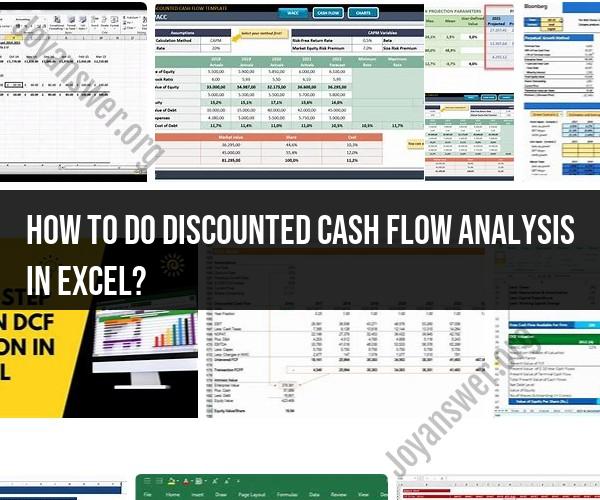
How to do discounted cash flow analysis in Excel?
Mastering Discounted Cash Flow Analysis in Excel: A Step-by-Step Guide
Discounted Cash Flow (DCF) analysis is a powerful financial modeling technique used to evaluate the intrinsic value of an investment, project, or company by estimating its future cash flows and discounting them to present value. In this step-by-step guide, we will walk you through the process of performing DCF analysis in Excel.
Step 1: Gather Financial Data
Begin by collecting the necessary financial data, including historical financial statements, revenue projections, and cost estimates. You will need this data to forecast future cash flows accurately.
Step 2: Set Up Your Excel Spreadsheet
Create a new Excel spreadsheet with columns for the following:
- Period (usually years or months)
- Cash Flow (CF): Estimate the future cash flows for each period.
- Discount Rate (DR): Determine an appropriate discount rate, often based on the company's cost of capital.
- Present Value (PV): Calculate the present value of each cash flow using the formula
PV = CF / (1 + DR)^Period.
Step 3: Forecast Future Cash Flows
Project the future cash flows for the investment or project. Be realistic and conservative in your estimates. Consider revenues, operating expenses, taxes, and capital expenditures.
Step 4: Determine the Discount Rate
Choose a discount rate that reflects the risk associated with the investment. Common options include the company's weighted average cost of capital (WACC) or a required rate of return based on the project's risk.
Step 5: Calculate Present Value
Apply the formula for present value to calculate the present value of each projected cash flow. Excel's NPV (Net Present Value) function is helpful for this task.
Step 6: Sum the Present Values
Sum all the present values of the projected cash flows to obtain the Net Present Value (NPV) of the investment. A positive NPV indicates that the investment is likely to be profitable.
Step 7: Sensitivity Analysis (Optional)
Perform sensitivity analysis by varying key inputs such as the discount rate or growth rates to understand how changes in these factors impact the NPV. This helps assess the model's sensitivity to different scenarios.
Step 8: Interpret the Results
Evaluate the calculated NPV. A positive NPV suggests that the investment is expected to generate value, while a negative NPV may indicate that the investment is not financially viable.
Step 9: Make an Informed Decision
Consider the NPV results in conjunction with other qualitative factors when making investment decisions. DCF analysis provides valuable insights, but it should be used in conjunction with other analyses and considerations.
Step 10: Document Your Analysis
Clearly document your assumptions, methodologies, and results in your Excel spreadsheet or a separate report. This documentation is vital for transparency and future reference.
Conclusion:
Mastering Discounted Cash Flow analysis in Excel empowers financial analysts, investors, and business professionals to make informed investment decisions. This step-by-step guide provides a solid foundation for performing DCF analysis effectively, helping you assess the value and potential of various investments and projects.