Can clustering be used as a multivariate analysis?
Clustering is a multivariate analysis technique commonly used in data analysis to identify patterns, group similar data points, and gain insights from large datasets. It's particularly useful when you have unlabelled data and want to discover inherent structures or relationships within the data. Here's how clustering can provide valuable data insights:
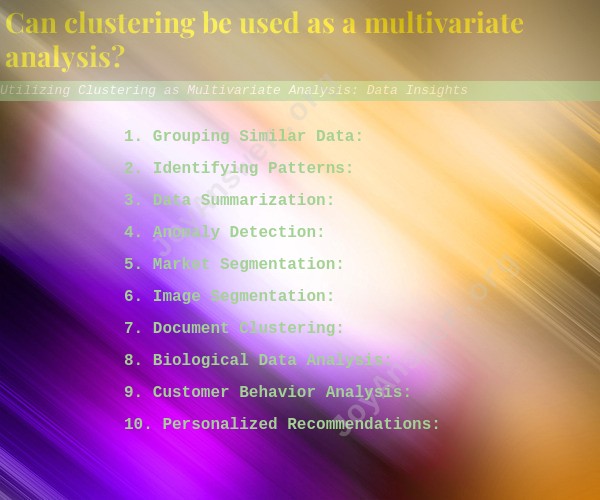
1. Grouping Similar Data:Clustering algorithms partition data points into groups or clusters based on the similarity of their features. This allows you to identify naturally occurring groups within your dataset. By grouping similar data points together, you can gain a better understanding of the inherent structure of your data.
2. Identifying Patterns:Clustering can reveal patterns and relationships that might not be immediately obvious. For example, in customer segmentation, clustering can help identify distinct customer segments based on their purchasing behavior, preferences, or demographics.
3. Data Summarization:Clustering provides a way to summarize large datasets by creating representative centroids or prototypes for each cluster. Instead of analyzing each individual data point, you can analyze the centroids to understand the characteristics of different groups.
4. Anomaly Detection:Clustering can also be used for anomaly detection. Outliers or data points that do not fit well within any cluster might indicate anomalies, errors, or unexpected behavior in your data.
5. Market Segmentation:In marketing, clustering can help segment customers into groups with similar characteristics, enabling businesses to tailor their marketing strategies and offerings to specific segments.
6. Image Segmentation:In image analysis, clustering can be used to segment images into regions of similar colors or textures. This is useful in fields like medical imaging and computer vision.
7. Document Clustering:Clustering can group similar documents together based on their content, which is useful in information retrieval and organizing large document collections.
8. Biological Data Analysis:In genomics and bioinformatics, clustering can help classify genes, proteins, or other biological entities based on their expression patterns or sequences.
9. Customer Behavior Analysis:Retailers can use clustering to analyze customer behavior and identify segments of customers with similar buying patterns, which can inform inventory management and marketing strategies.
10. Personalized Recommendations:Clustering can assist in providing personalized recommendations by grouping users with similar preferences, helping improve the accuracy of recommendation systems.
It's important to choose the appropriate clustering algorithm based on your data and objectives. Common clustering algorithms include K-Means, Hierarchical Clustering, and DBSCAN, among others. The insights gained from clustering can provide a foundation for further analysis, decision-making, and targeted strategies in various fields.
