How to create a simple report in Excel?
Creating a simple report in Excel involves organizing and presenting data in a structured and readable format. Here are step-by-step instructions for creating a basic report in Excel:
Step 1: Open Excel
- Launch Microsoft Excel on your computer. If you don't have Excel, you can use a free alternative like Google Sheets.
Step 2: Enter Data
- Enter the data you want to include in your report into an Excel worksheet. You can type the data directly into cells or copy and paste it from another source.
Step 3: Format Data
- Apply formatting to your data to make it more readable. You can format cells for headings, numbers, dates, and text. For example, you can use bold for headings, apply number formatting for decimal places, and format dates in a consistent style.
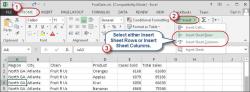
Step 4: Add Headers and Footers
- If your report is multiple pages long, you can add headers and footers to include titles, page numbers, and other information. To do this, go to the "Insert" tab and select "Header & Footer."
Step 5: Create a Title
- Add a title to your report to introduce its content. This can be placed at the top of the worksheet. You can format the title for emphasis, such as making it larger or bold.
Step 6: Organize Data
- Use columns and rows to organize your data logically. You can create categories or sections within your report to group related information together. For example, if you're creating a sales report, you can have separate sections for monthly sales, quarterly summaries, and year-to-date totals.
Step 7: Use Formulas
- Excel offers powerful formula and calculation capabilities. You can use Excel formulas to calculate totals, averages, percentages, or any other relevant data. Formulas can help automate calculations and reduce errors.
Step 8: Create Charts or Graphs (Optional)
- If your data can be better understood through visual representation, consider creating charts or graphs. Excel provides various chart types, such as bar charts, pie charts, and line charts. Select the data and choose a chart type from the "Insert" tab.
Step 9: Add Text and Labels
- Use text and labels to explain the data, provide context, and guide the reader through the report. You can insert text boxes or use cell comments to add annotations.
Step 10: Format Page Layout
- Adjust the page layout settings, such as margins, orientation (portrait or landscape), and page size, to ensure the report looks as you want when printed or shared digitally. Go to the "Page Layout" tab to make these adjustments.
Step 11: Proofread and Review
- Carefully review your report for accuracy, consistency, and readability. Correct any errors, and ensure that the report follows a logical flow.
Step 12: Save and Share
- Save your Excel report in a location of your choice. You can save it as an Excel file or export it as a PDF for easier sharing.
Creating a simple report in Excel involves organizing and presenting data in a structured and readable format. Here are step-by-step instructions for creating a basic report in Excel:
Step 1: Open Excel
Launch Microsoft Excel on your computer. If you don't have Excel, you can use a free alternative like Google Sheets.
Step 2: Enter Data
Enter the data you want to include in your report into an Excel worksheet. You can type the data directly into cells or copy and paste it from another source.
Step 3: Format Data
Apply formatting to your data to make it more readable. You can format cells for headings, numbers, dates, and text. For example, you can use bold for headings, apply number formatting for decimal places, and format dates in a consistent style.
Step 4: Add Headers and Footers
If your report is multiple pages long, you can add headers and footers to include titles, page numbers, and other information. To do this, go to the "Insert" tab and select "Header & Footer."
Step 5: Create a Title
Add a title to your report to introduce its content. This can be placed at the top of the worksheet. You can format the title for emphasis, such as making it larger or bold.
Step 6: Organize Data
Use columns and rows to organize your data logically. You can create categories or sections within your report to group related information together. For example, if you're creating a sales report, you can have separate sections for monthly sales, quarterly summaries, and year-to-date totals.
Step 7: Use Formulas
Excel offers powerful formula and calculation capabilities. You can use Excel formulas to calculate totals, averages, percentages, or any other relevant data. Formulas can help automate calculations and reduce errors.
Step 8: Create Charts or Graphs (Optional)
If your data can be better understood through visual representation, consider creating charts or graphs. Excel provides various chart types, such as bar charts, pie charts, and line charts. Select the data and choose a chart type from the "Insert" tab.
Step 9: Add Text and Labels
Use text and labels to explain the data, provide context, and guide the reader through the report. You can insert text boxes or use cell comments to add annotations.
Step 10: Format Page Layout
Adjust the page layout settings, such as margins, orientation (portrait or landscape), and page size, to ensure the report looks as you want when printed or shared digitally. Go to the "Page Layout" tab to make these adjustments.
Step 11: Proofread and Review
Carefully review your report for accuracy, consistency, and readability. Correct any errors, and ensure that the report follows a logical flow.
Step 12: Save and Share
Save your Excel report in a location of your choice. You can save it as an Excel file or export it as a PDF for easier sharing.
These steps will help you create a simple and well-organized report in Excel. The specific details of your report, such as its content and purpose, will determine how you apply these steps.
How to create a straightforward report in Excel for your data?
To create a straightforward report in Excel for your data, you can follow these steps:
- Enter your data into Excel. You can either enter your data manually or import it from another source, such as a CSV file or a database.
- Organize your data. Make sure your data is organized in a logical way, with column headings for each field.
- Apply formulas and functions. You can use Excel's formulas and functions to calculate summary statistics, create charts, and perform other data analysis tasks.
- Format your report. Use Excel's formatting features to make your report look professional and easy to read. This includes things like using borders, fonts, and colors.
- Save your report. Once you are finished, save your report so that you can refer to it later.
What are the basic steps to design and format a simple Excel report?
Here are the basic steps to design and format a simple Excel report:
- Choose a template. Excel offers a variety of templates that you can use to create reports. You can also create your own custom template.
- Format your data. Use Excel's formatting features to make your data look neat and easy to read. This includes things like using borders, fonts, and colors.
- Add charts and graphs. Charts and graphs can help you to visualize your data and make it easier to understand.
- Add a title and header. Give your report a title and header so that people will know what it is about and who created it.
- Proofread your report. Before you share your report, be sure to proofread it carefully for any errors.
How to effectively present information in a clear and organized manner using Excel?
Here are some tips for effectively presenting information in a clear and organized manner using Excel:
- Use a consistent layout and formatting throughout your report.
- Use clear and concise language.
- Avoid using jargon or acronyms that your audience may not understand.
- Use charts and graphs to visualize your data and make it easier to understand.
- Break up your report into sections and use headings to organize the information.
- Use a table of contents to make it easy for readers to find the information they are looking for.
- Proofread your report carefully for any errors.
By following these tips, you can create straightforward and effective Excel reports that will communicate your message clearly to your audience.