How do I add a solver table to excel?
In Microsoft Excel, you can use the Solver add-in to perform complex what-if analyses and find optimal solutions to problems involving multiple variables and constraints. A Solver Table is a feature that allows you to view the results of multiple Solver runs in a table format. Here's a step-by-step guide on how to add a Solver Table to Excel:
Step 1: Install and Enable Solver Add-InIf you haven't already, you need to install and enable the Solver add-in in Excel. Here's how to do it:
Open Excel.
Go to the "File" tab (Excel 2010 and later) or the "Office" button (Excel 2007).
Select "Options" or "Excel Options" (depending on your Excel version).
In the Excel Options dialog, click "Add-Ins" on the left sidebar.
In the "Add-Ins" section at the bottom, select "Excel Add-ins" in the Manage box and click "Go."
Check the "Solver Add-in" option and click "OK."
Step 2: Set Up Your Solver ProblemBefore you can create a Solver Table, you need to set up your Solver problem by defining the target cell, variables, and constraints. You can do this by following these general steps:
Select the cell you want to optimize (the target cell).
Go to the "Data" tab and click "Solver" in the Analysis group. This opens the Solver Parameters dialog.
In the Solver Parameters dialog, specify the objective to maximize or minimize (usually a formula or cell reference) in the "Set Objective" box.
Define the variables that affect the objective in the "By Changing Variable Cells" box. These are the cells that Solver can adjust to optimize the objective.
Set constraints, if any, by clicking the "Add" button in the "Subject to the Constraints" section. Constraints are conditions that the variable cells must satisfy.
Configure Solver options, such as the target value, constraints, and solving method.
Click "OK" to close the Solver Parameters dialog.
Step 3: Solve the ProblemAfter setting up your Solver problem, click the "Solve" button in the Solver Parameters dialog to find the optimal solution. Solver will adjust the variable cells to meet the constraints and optimize the objective.
Step 4: Create a Solver TableOnce Solver has found a solution, you can create a Solver Table to view the results of different scenarios. Follow these steps:
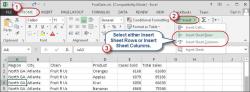
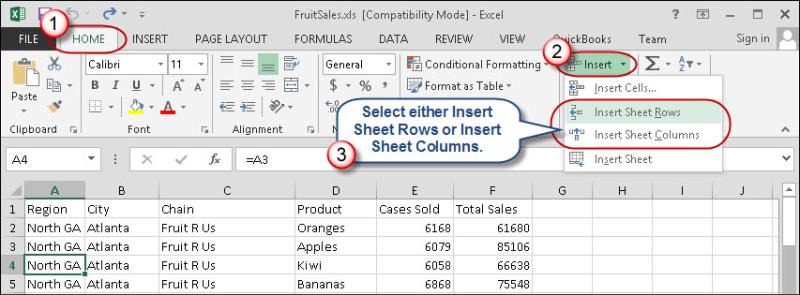
Go to an empty area of your Excel worksheet where you want to create the table.
On the "Data" tab, click "What-If Analysis" in the Data Tools group, and select "Data Table."
In the Data Table dialog, enter the reference to the cell that contains the formula or function you optimized in the "Column input cell" box. This is the cell Solver adjusted during the optimization.
In the "Row input cell" box, enter the reference to the cell that you used as a variable in your Solver problem.
Click "OK" to create the Solver Table. Excel will populate the table with different values for the variable cell and show the corresponding results for the objective cell.
You now have a Solver Table that displays the results of running Solver with different values for the variable cell. This allows you to perform sensitivity analysis and see how changes in the variable affect the optimized result.
Adding a Solver Table to Excel: Step-by-Step Instructions
The Solver Table add-in in Microsoft Excel is a powerful tool for analyzing and optimizing spreadsheet models. It allows you to perform sensitivity analysis by automatically changing one or two input variables and calculating the resulting changes in one or more output variables. This can help you to identify the optimal values for your input variables and make better informed decisions.
Step 1: Install the Solver Table Add-in
Open Excel and click on the "File" tab.
In the left-hand pane, click on "Options".
In the Excel Options dialog box, click on the "Add-Ins" category.
In the Manage box, select "Excel Add-ins" and click on the "Go" button.
In the Add-Ins dialog box, check the box next to "Solver Table" and click on "OK".
If the Solver Table add-in is not listed in the Add-Ins dialog box, you will need to download and install it from the Microsoft website.
Step 2: Set Up Your Spreadsheet Model
Enter your input variables into the spreadsheet.
Enter the formulas that calculate your output variables.
Make sure that your input and output variables are clearly labeled.
Step 3: Create a Solver Table
Click on the "Data" tab.
In the Analysis group, click on the "Solver Table" button.
In the Set Objective box, select the cell that contains the output variable that you want to maximize or minimize.
In the By Changing Variable Cells box, select the cell that contains the input variable that you want to change.
In the To box, select the value that you want to change the input variable to.
Click on the "Add" button to add another input variable.
Click on the "OK" button to run the Solver Table.
Step 4: Analyze the Results
The Solver Table will create a new table that shows the results of changing the input variables. The table will show the values of the input variables, the values of the output variables, and the constraints that were used.
You can use the Solver Table to identify the optimal values for your input variables and to make better informed decisions.
Utilizing Excel's Solver Tool to Generate Tables
Excel's Solver Table add-in is a valuable tool for sensitivity analysis. It allows you to quickly and easily generate tables that show the results of changing one or two input variables in your spreadsheet model. This can be a very helpful way to understand how your model works and to identify the optimal values for your input variables.
Benefits of Using Solver Table:
Efficient Sensitivity Analysis: Easily analyze the impact of changing input variables on output variables.
Identify Optimal Input Values: Determine the input values that lead to desired output outcomes.
Visualize Results: Generate tables that clearly present the effects of input changes.
Enhance Decision-Making: Make informed decisions based on comprehensive analysis of input-output relationships.
Applications of Solver Table:
Financial Modeling: Analyze the impact of different interest rates, loan terms, or investment strategies on financial outcomes.
Production Planning: Determine optimal production levels and resource allocation to meet demand and minimize costs.
Marketing Optimization: Evaluate the effectiveness of different marketing campaigns and budget allocations.
Scientific Experiments: Analyze the effects of different experimental conditions on scientific outcomes.
Risk Management: Assess the impact of various risk factors on project outcomes and potential losses.
Enhancing Excel Spreadsheets with Solver Tables
Solver Tables can significantly enhance the capabilities of Excel spreadsheets by providing a powerful tool for sensitivity analysis and decision-making. By incorporating Solver Tables into your spreadsheet models, you can:
Gain Deeper Insights: Uncover hidden patterns and relationships between input and output variables.
Make Better Predictions: Improve the accuracy of predictions and forecasts based on sensitivity analysis.
Optimize Resource Allocation: Allocate resources more efficiently to maximize outcomes and minimize costs.
Support Informed Decisions: Enhance decision-making processes with data-driven insights and sensitivity analysis.
Increase Spreadsheet Versatility: Expand the capabilities of Excel spreadsheets beyond simple calculations to complex analyses and optimization.