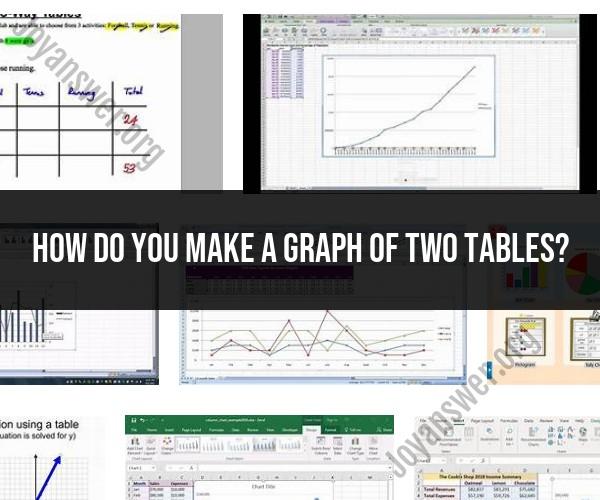
How do you make a graph of two tables?
To create a graph or data visualization using data from two tables, you typically need to combine the data from both tables into a single dataset and then use that combined dataset to generate your graph. Here are the general steps:
Step 1: Understand Your Data:
- Review the data in both tables and determine how they are related or what common elements they share. You should have a key or identifier that allows you to link the data from one table to the other.
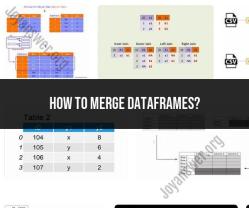
Step 2: Merge or Join the Tables:
- Use a data manipulation tool or software like Microsoft Excel, Google Sheets, or a programming language like Python or R to merge or join the two tables based on the common key or identifier. The method you use will depend on the specific software you're using.
- In Excel or Google Sheets, you can use functions like VLOOKUP or INDEX/MATCH to combine data from multiple tables.
Step 3: Prepare Your Data:
- After merging the tables, you may need to clean and format the data as necessary. Ensure that it is in a format suitable for creating the type of graph you want.
Step 4: Create the Graph:
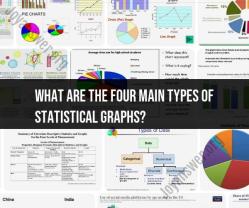
- Using the combined and prepared data, you can now create your graph or data visualization. The type of graph you choose will depend on the nature of your data and what you want to convey. Common types of graphs include bar charts, line graphs, scatter plots, and pie charts.
Step 5: Customize and Label Your Graph:
- Customize the appearance of your graph to make it visually appealing and easy to understand. You can adjust colors, labels, titles, axis scales, and legends to enhance clarity.
- Ensure that your graph includes appropriate labels and a clear legend to explain the data being presented.
Step 6: Interpret and Analyze:
- Once you have created your graph, take the time to interpret and analyze the data it represents. What insights or trends can you glean from the visualization?
Step 7: Share or Present Your Graph:
- Depending on your purpose, you can share your graph in reports, presentations, or online platforms to communicate your findings to others.
The specific software and methods you use to merge and visualize data from two tables will vary depending on your needs and familiarity with data analysis tools. Popular data analysis software like Microsoft Excel, Google Sheets, Python (with libraries like Pandas and Matplotlib), and R provide versatile options for working with and visualizing data from multiple sources.