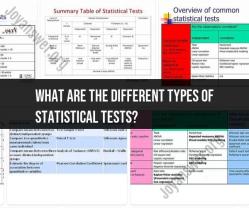
What are the different types of statistical tests?
Statistical tests, also known as hypothesis tests or inferential statistics, are used to make inferences or draw conclusions about a population based on sample data. There are various types of statistical tests, each designed for specific purposes and data types. Here are some common types of statistical tests:
Parametric Tests:
- Student's t-Test: Used to compare the means of two independent groups.
- Analysis of Variance (ANOVA): Used to compare means of three or more groups.
- Paired t-Test: Compares means of two related groups (e.g., before and after treatment).
- One-Way ANOVA: Compares means of three or more independent groups.
- Two-Way ANOVA: Examines the influence of two categorical independent variables on a dependent variable.
Nonparametric Tests:
- Mann-Whitney U Test: Nonparametric equivalent of the independent t-test.
- Wilcoxon Signed-Rank Test: Nonparametric equivalent of the paired t-test.
- Kruskal-Wallis Test: Nonparametric alternative to one-way ANOVA.
- Chi-Square Test: Used for analyzing categorical data and testing for independence.
- Fisher's Exact Test: Examines the association between two categorical variables when sample sizes are small.
Correlation Tests:
- Pearson Correlation Coefficient: Measures the strength and direction of a linear relationship between two continuous variables.
- Spearman Rank Correlation: Assesses the strength and direction of a monotonic relationship between two variables, which may not be linear.
Regression Analysis:
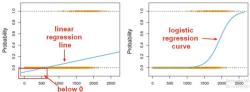
- Linear Regression: Examines the linear relationship between a dependent variable and one or more independent variables.
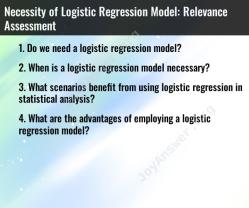
- Logistic Regression: Used when the dependent variable is binary or categorical, predicting the probability of an event occurring.
Chi-Square Tests:
- Chi-Square Goodness of Fit Test: Tests whether observed data matches expected data in a categorical variable.
- Chi-Square Test for Homogeneity: Assesses whether different groups have the same distribution of a categorical variable.
- Chi-Square Test for Independence: Examines the association between two categorical variables.
Time-Series Analysis:
- Autocorrelation: Measures the correlation of a variable with itself over different time intervals.
- ARIMA (AutoRegressive Integrated Moving Average): Used for forecasting and analyzing time-series data.
Survival Analysis:
- Kaplan-Meier Survival Analysis: Estimates survival probabilities over time in medical and life sciences research.
- Cox Proportional Hazards Model: Examines the impact of multiple variables on survival time.
Multivariate Analysis:
- Principal Component Analysis (PCA): Reduces dimensionality of data by finding patterns and correlations among variables.
- Factor Analysis: Examines the underlying structure of a set of observed variables.
These are just some of the many statistical tests available for different research scenarios and data types. The choice of which test to use depends on the research question, data distribution, and assumptions about the data. It's essential to select the appropriate test to ensure the validity of statistical analyses and research findings.