How to calculate absolute deviation?
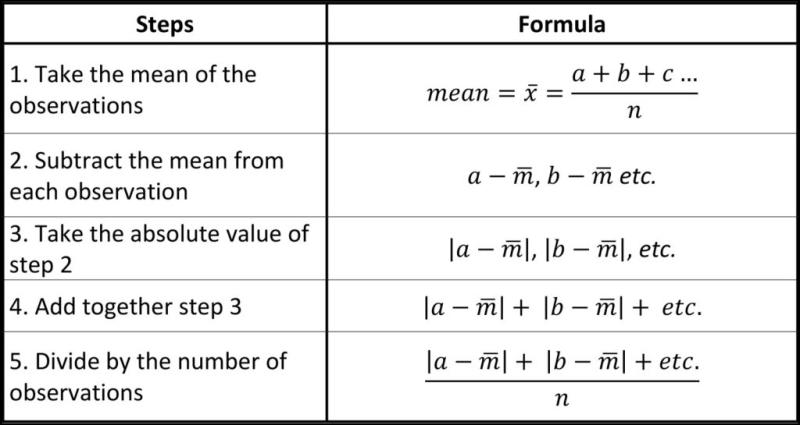
Absolutely! Absolute deviation measures the average distance between each data point in a dataset and a central point, often the mean or median. It's calculated by finding the absolute value of the difference between each data point and the chosen central point, then averaging these absolute differences. Here are the steps to calculate absolute deviation:
Identify the Central Point: Choose a central point around which you want to measure the deviation. Typically, this is the mean or median of the dataset.
Find the Differences: For each data point in the dataset, calculate the difference between that point and the chosen central point.
If you're using the mean as the central point (mean absolute deviation), the formula for each data point is:
If you're using the median as the central point (median absolute deviation), the formula for each data point is:
Calculate the Absolute Deviation: Take the absolute value of each difference calculated in step 2.
Average the Absolute Differences: Sum up all the absolute differences calculated in step 3 and divide by the total number of data points in the dataset to get the average absolute deviation.
If you're calculating mean absolute deviation (MAD), the formula is:
If you're calculating median absolute deviation (MdnAD), the formula is:
For example, suppose you have a dataset: 5, 8, 10, 12, 15, and you want to calculate the mean absolute deviation from the mean.
- Find the mean:
- Calculate the absolute differences:
- Find the average of these absolute differences:
This result (2.8) represents the mean absolute deviation of the dataset from its mean.
How is Absolute Deviation calculated in statistics?
Absolute deviation is a measure of dispersion or variability in statistics. It represents the average distance between each data point and the central tendency of the data set. The central tendency can be the mean, median, or mode, depending on the context.
To calculate the absolute deviation, follow these steps:
Calculate the mean, median, or mode of the data set. This will serve as the central reference point.
For each data point, calculate the absolute difference between the data point and the central tendency. The absolute difference is simply the non-negative difference between the two values.
Average the absolute differences obtained in step 2. This average represents the absolute deviation of the data set.
For example, consider the data set {2, 4, 5, 6, 8}. The mean of this data set is 5. To calculate the absolute deviation, follow these steps:
- Calculate the absolute difference between each data point and the mean:
| Data Point | Distance from Mean |
|---|---|
| 2 | 3 |
| 4 | 1 |
| 5 | 0 |
| 6 | 1 |
| 8 | 3 |
- Average the absolute differences:
(3 + 1 + 0 + 1 + 3) / 5 = 8 / 5 = 1.6
Therefore, the absolute deviation of the data set {2, 4, 5, 6, 8} is 1.6.
What does Absolute Deviation signify in data analysis?
Absolute deviation provides a measure of how spread out the data points are from the central tendency. A larger absolute deviation indicates that the data points are more dispersed, while a smaller absolute deviation suggests that the data points are more tightly clustered around the central tendency.
In data analysis, absolute deviation is often used to:
Assess the variability or dispersion of a data set.
Compare the variability of different data sets.
Identify outliers or data points that deviate significantly from the rest of the data.
Evaluate the consistency or stability of a data set.
Are there variations or interpretations of Absolute Deviation?
Yes, there are a few variations of absolute deviation, each with slightly different interpretations:
Mean Absolute Deviation (MAD): MAD is the most common type of absolute deviation and is calculated as described above. It represents the average distance between each data point and the mean of the data set.
Median Absolute Deviation (MAD): MAD is less sensitive to outliers than MAD and is calculated by finding the median of the absolute differences between each data point and the median of the data set.
Quartile Deviation (QD): QD is similar to MAD but uses quartiles instead of the median. It represents the average distance between each data point and the first or third quartile of the data set.
How does Absolute Deviation relate to other measures of dispersion in statistics?
Absolute deviation is closely related to other measures of dispersion, such as variance and standard deviation. Variance and standard deviation are based on the squared deviations from the mean, while absolute deviation uses the absolute differences. As a result, absolute deviation is less sensitive to outliers than variance and standard deviation.
Here's a table summarizing the relationship between absolute deviation, variance, and standard deviation:
| Measure | Formula | Interpretation |
|---|---|---|
| Absolute Deviation (AD) | Average absolute difference from the mean | Represents the average distance from the central tendency |
| Variance (V) | Average squared difference from the mean | Measures the spread of data around the mean, but sensitive to outliers |
| Standard Deviation (SD) | Square root of variance | Represents the typical distance from the mean, but also sensitive to outliers |
Can Absolute Deviation be used to evaluate the consistency of data sets?
Yes, absolute deviation can be used to evaluate the consistency of data sets. A data set with a small absolute deviation is considered more consistent, meaning that the data points are tightly clustered around the central tendency. Conversely, a data set with a large absolute deviation is considered less consistent, indicating that the data points are more dispersed.
In addition to absolute deviation, other measures of dispersion, such as variance and standard deviation, can also be used to assess the consistency of data sets. However, absolute deviation is often preferred in situations where outliers are present because it is less sensitive to these extreme values.