How do you calculate the mean absolute deviation?
The Mean Absolute Deviation (MAD) is a statistical measure of the dispersion or spread of a set of values. It represents the average absolute difference between each data point and the mean of the data set. Here's how you can calculate the Mean Absolute Deviation:
Steps to Calculate Mean Absolute Deviation:
Calculate the Mean (Average):
- Add up all the values in the dataset and then divide by the total number of values. The result is the mean ().
Calculate the Absolute Deviation for Each Data Point:
- Subtract the mean () from each individual data point and take the absolute value. This gives you the absolute deviation for each data point.
Calculate the Mean of Absolute Deviations:
- Find the average of all the absolute deviations calculated in the previous step. Sum up all the absolute deviations and then divide by the total number of values (n).
Example:
Let's say you have the following dataset:
Step 1: Calculate the Mean ()
Step 2: Calculate the Absolute Deviation for Each Data Point
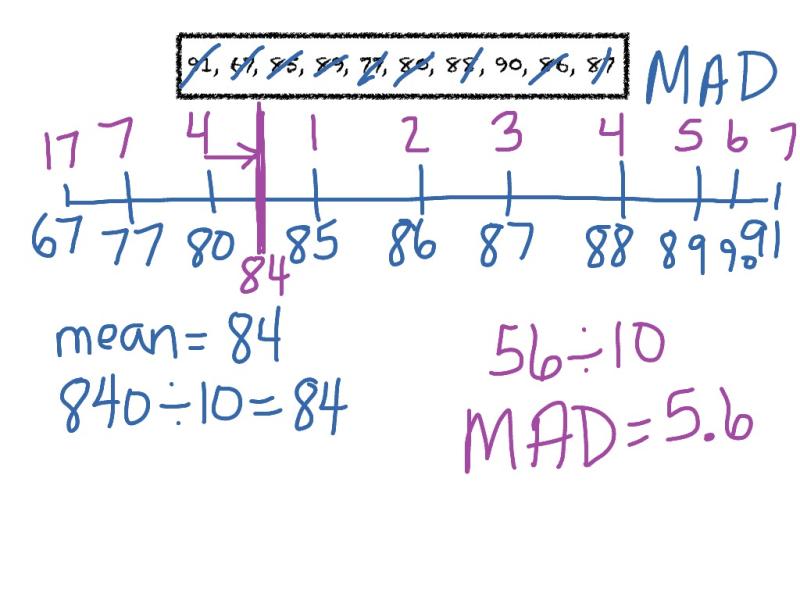
Step 3: Calculate the Mean of Absolute Deviations (MAD)
Therefore, the Mean Absolute Deviation for this dataset is 3.6.
The MAD is a useful measure of dispersion, but it is sensitive to extreme values. It provides a sense of how spread out the values in a dataset are on average, without considering the direction of the deviations.
Sure, here are the answers to your questions:
What steps are involved in calculating the Mean Absolute Deviation (MAD)?
Calculating the Mean Absolute Deviation (MAD) involves a few straightforward steps:
Gather the data: Collect the set of data points for which you want to calculate the MAD.
Determine the mean: Calculate the mean of the data points. The mean is the average of all the values in the dataset.
Calculate the absolute deviations: For each data point, subtract the mean and find the absolute value of the difference. This represents the absolute deviation from the mean.
Sum the absolute deviations: Add up all the absolute deviations you calculated in step 3.
Calculate the MAD: Divide the sum of absolute deviations by the number of data points. This gives you the Mean Absolute Deviation.
What mathematical formula is used to determine the Mean Absolute Deviation?
The mathematical formula for calculating the Mean Absolute Deviation (MAD) is:
MAD = Σ |xᵢ - x̄| / n
Where:
- MAD represents the Mean Absolute Deviation
- xᵢ represents each data point in the dataset
- x̄ represents the mean of the data points
- n represents the total number of data points
How is the Mean Absolute Deviation utilized in statistical analysis?
The Mean Absolute Deviation (MAD) is a measure of statistical dispersion, indicating the average distance between data points and the mean. It is commonly used to assess the variability or spread of a dataset. MAD is less sensitive to outliers compared to other measures like variance or standard deviation, making it a robust choice for analyzing data with outliers.
Are there practical applications of Mean Absolute Deviation in real-life scenarios?
Mean Absolute Deviation (MAD) has various practical applications in real-life scenarios. Here are a few examples:
Evaluating forecasting models: MAD is used to assess the accuracy of forecasting models by comparing the predicted values to the actual values. A lower MAD indicates a more accurate forecasting model.
Analyzing stock market performance: MAD is used to evaluate the volatility of stock prices, indicating the average fluctuation of a stock's price around its mean. A higher MAD suggests greater volatility.
Measuring manufacturing process variation: MAD is used to assess the consistency of manufacturing processes by measuring the average deviation from the target specifications. A lower MAD indicates a more precise manufacturing process.
Evaluating customer satisfaction surveys: MAD is used to analyze customer satisfaction surveys by measuring the average deviation from the mean satisfaction rating. A lower MAD suggests higher overall customer satisfaction.
Assessing financial performance: MAD is used to compare the financial performance of different companies or time periods by analyzing the deviation from a benchmark or target value. A lower MAD indicates better financial performance.
These examples demonstrate the versatility of Mean Absolute Deviation in various real-world applications.
What role does the Mean Absolute Deviation play in understanding data variability?
The Mean Absolute Deviation (MAD) plays a crucial role in understanding data variability. It provides a measure of how spread out the data points are around the mean. A higher MAD indicates greater variability, suggesting that the data points are more dispersed from the mean. Conversely, a lower MAD indicates lower variability, suggesting that the data points are more tightly clustered around the mean.
MAD is particularly useful when there are outliers in the data, as it is less sensitive to extreme values compared to other measures of dispersion like variance or standard deviation. This makes MAD a more robust measure for understanding data variability in the presence of outliers.