How to format numbers in SSRs?
In SQL Server Reporting Services (SSRS), you can format numbers to control their appearance in your reports. Number formatting allows you to specify how numbers are displayed, including the use of currency symbols, decimal places, and thousand separators. Here's a comprehensive guide on how to format numbers in SSRS:
Open Your SSRS Report:
- Open the SQL Server Data Tools (SSDT) or Report Builder, depending on your environment.
- Load your SSRS report project or create a new report.
Select the Textbox Containing the Number:
- Identify the textbox in your report that contains the number you want to format.
- Click on the textbox to select it.
Access the Properties Window:
- If you don't see the Properties window, go to the "View" menu and select "Properties Window" to display it.
Locate the Number Format Property:
- In the Properties window, locate the "NumberFormat" property. This property allows you to specify the format for the selected textbox.
Choose a Number Format:
- Click on the "NumberFormat" property, and you'll see a small ellipsis button ("...") on the right side. Click this button to open the Number Format dialog box.
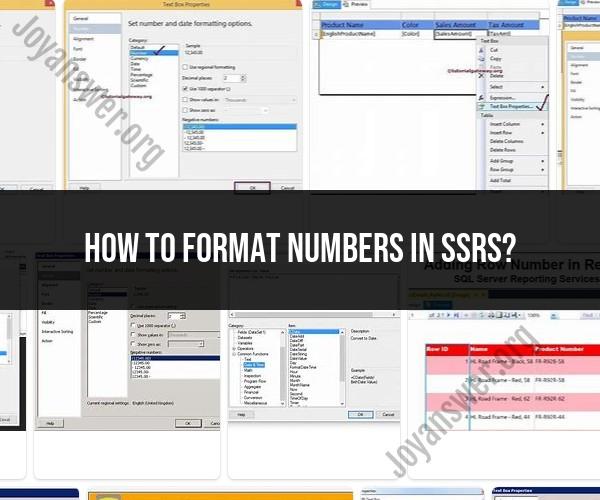
Customize the Number Format:
- In the Number Format dialog box, you can customize the formatting of the number. Here are some common formatting options:
- Number: Choose the format for the number. This includes options like "General Number," "Currency," "Percentage," etc.
- Decimal Places: Specify the number of decimal places you want to display.
- Use 1000 Separator (,): Check this box to use a thousand separator (e.g., commas in large numbers).
- Currency Symbol: If you're formatting as currency, specify the currency symbol.
- Negative Numbers: Define how negative numbers should be displayed, such as with parentheses or a minus sign.
- Custom Format: You can enter a custom number format using placeholders and special characters.
- In the Number Format dialog box, you can customize the formatting of the number. Here are some common formatting options:
Apply the Number Format:
- After customizing the format, click "OK" to close the Number Format dialog box.
Preview Your Report:
- Save your report if necessary and then preview it to see how the numbers are formatted according to your settings.
Repeat for Other Textboxes:
- If you have multiple textboxes containing numbers that need formatting, repeat the above steps for each textbox.
Save and Deploy:
- Once you're satisfied with the formatting, save your report, and if you're working in SSDT, deploy it to your report server or web portal for others to access.
By following these steps, you can format numbers in your SSRS reports to meet your specific requirements, ensuring that your reports are both informative and visually appealing.