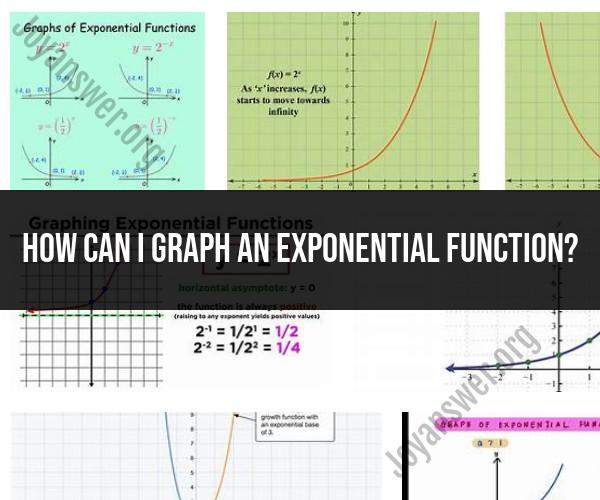
How can I graph an exponential function?
Graphing an exponential function involves several steps to accurately represent the behavior of the function on a coordinate plane. Here's a step-by-step guide to graphing exponential functions:
Let's assume you have an exponential function in the form of:
where:
- is the initial value or the y-intercept (the value of when ).
- is the base of the exponential function, which should be greater than 1 for exponential growth or between 0 and 1 for exponential decay.
- is the input variable, and is the output or function value.
Step 1: Determine the DomainIdentify the domain of the function, which is typically all real numbers (), but there may be restrictions depending on the context of the problem.
Step 2: Find the Initial Value (y-intercept)The initial value, , is the value of the function when . Calculate to find the initial point on the graph.
Step 3: Choose Values for Select a few values for that cover the desired range. It's a good practice to choose values that are both positive and negative, as well as values close to zero.
Step 4: Calculate Corresponding ValuesUse the exponential function formula to calculate the corresponding values for the chosen values. Plug each value into the function to find .
Step 5: Create a Table of ValuesCreate a table of values that pairs the selected values with their corresponding values. This table will help you plot points on the graph.
Step 6: Plot Points on the GraphOn a coordinate plane, plot the points from your table of values. Use the selected values of as the x-coordinates and the calculated values as the y-coordinates.
Step 7: Draw the Exponential CurveConnect the plotted points with a smooth curve. Exponential functions have a characteristic shape: for exponential growth (), the curve increases rapidly as becomes more positive, and for exponential decay (), the curve decreases rapidly as becomes more positive.
Step 8: Label the Axes and Add a TitleLabel the x-axis and y-axis with appropriate units or labels based on the context of the problem. Add a title to your graph if necessary.
Step 9: Determine Asymptotes (Optional)If your exponential function approaches a horizontal line (horizontal asymptote) or a vertical line (vertical asymptote), indicate these asymptotes on the graph.
Step 10: Analyze the GraphExamine the graph to understand the behavior of the exponential function, including its growth or decay rate and any critical points or intersections with other functions or lines.
Remember that when dealing with exponential functions, the base significantly influences the shape of the graph. Larger values of lead to steeper growth, while values of between 0 and 1 lead to exponential decay.
By following these steps, you can accurately graph exponential functions and gain insights into their behavior.