How to calculate standard deviation?
The standard deviation can be calculated using a few different methods. Here are two common approaches:
Using the Formula:
Population Standard Deviation: If you have the entire population's data, you can use this formula:Where:
- = population standard deviation
- = each individual value in the population
- = population mean
- = number of values in the population
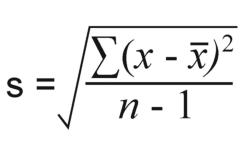
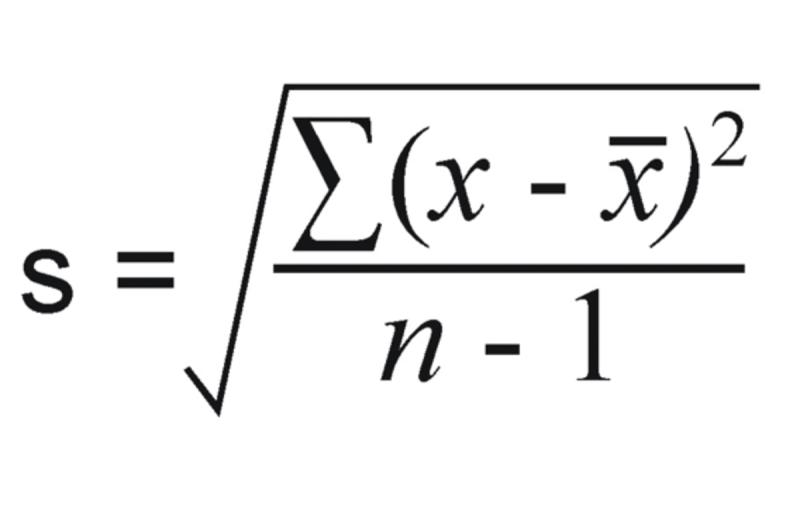
Sample Standard Deviation: If you have a sample from a larger population, use this formula:Where:
- = sample standard deviation
- = each individual value in the sample
- = sample mean
- = number of values in the sample
Using Statistical Software or Calculators:
- Statistical software packages like Excel, R, Python (with libraries like NumPy), or dedicated statistical calculators have functions to calculate the standard deviation. You input the data, and the software or calculator computes the standard deviation for you.
Remember, the standard deviation measures the amount of variation or dispersion in a set of values. It helps in understanding how spread out the values in a dataset are from the mean. The formula involves several steps: finding the mean, calculating the differences from the mean, squaring those differences, finding the mean of the squared differences, and finally, taking the square root. Using software or calculators can simplify this process, especially with larger datasets.
What formulas or mathematical processes are utilized in standard deviation calculations?
Standard deviation, a measure of the dispersion or variability of a dataset, is calculated using formulas and mathematical processes that involve calculating the mean, squared deviations from the mean, and the square root of the variance. Here's a breakdown of the formulas and processes involved:
Calculating the Mean (μ):
- Mean (μ) = Σx_i / n
In this formula, μ represents the mean, x_i represents each individual data point, and n represents the total number of data points in the dataset. The summation (Σ) symbol indicates that we are adding up all the data points (x_i).
Calculating the Squared Deviations from the Mean:
- Squared Deviation = (x_i - μ)^2
Here, (x_i - μ) represents the deviation of each data point (x_i) from the mean (μ). Squaring this deviation ensures that positive and negative deviations have equal weight in the standard deviation calculation.
Summing the Squared Deviations:
- Σ(x_i - μ)^2
This step involves adding up all the squared deviations from the mean, calculated in step 2.
Calculating the Variance (σ^2):
- Variance (σ^2) = Σ(x_i - μ)^2 / n
This formula calculates the variance, which is the average squared deviation from the mean. Dividing the sum of squared deviations by the total number of data points (n) ensures that the variance is not affected by the sample size.
Calculating the Standard Deviation (σ):
- Standard Deviation (σ) = √(Σ(x_i - μ)^2 / n)
Finally, the standard deviation is calculated by taking the square root of the variance. This step scales the variance back to the original units of the data, making it easier to interpret and compare between datasets.
These formulas and mathematical processes provide a comprehensive approach to calculating standard deviation, enabling us to understand the spread and variability of data in various fields.