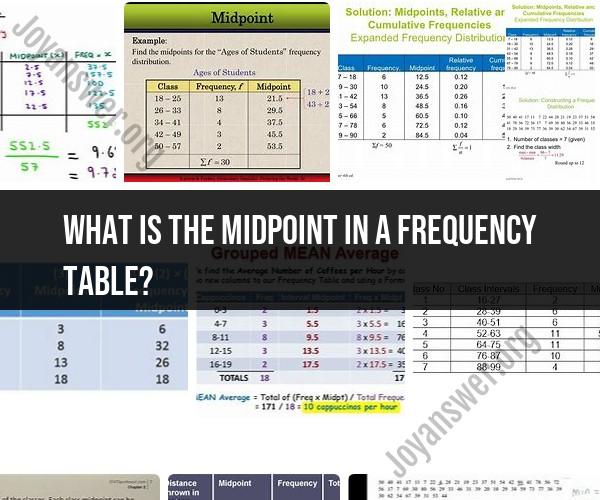
What is the midpoint in a frequency table?
In a frequency table, the midpoint (also known as the class midpoint or class mark) represents the middle value within each class interval or category. It is used to summarize and represent the data more effectively. The midpoint is significant because it allows you to approximate where the data within a class interval is concentrated, even if you don't have the exact data points.
Here's how to calculate the midpoint of a class interval in a frequency table:
Identify the Class Interval: A frequency table typically consists of class intervals or categories, each representing a range of values. For example, if you have a class interval "10-19," it represents values from 10 to 19.
Calculate the Midpoint: To find the midpoint of a class interval, you take the average or mean of the lower and upper limits of the interval. The formula for calculating the midpoint (M) is:
M = (Lower Limit + Upper Limit) / 2
- M: Midpoint
- Lower Limit: The lower boundary or value of the class interval.
- Upper Limit: The upper boundary or value of the class interval.
Record the Midpoint: Once you calculate the midpoint for each class interval, you can list them in a new column alongside the corresponding frequency.
The midpoint is useful because it provides a representative value for each class interval, making it easier to interpret and analyze the data. It is often used in statistical calculations, such as finding the mean of grouped data, calculating weighted averages, and constructing histograms or bar charts. Additionally, midpoints can help you understand the central tendencies and patterns in your data, even when the data is grouped into intervals.
For example, if you have a frequency table for ages with class intervals like "20-29," "30-39," and so on, finding the midpoints helps you understand the approximate age range within each category and analyze the age distribution more effectively.
Calculating the Midpoint in a Frequency Table
The midpoint of a class interval in a frequency table is the average of the upper and lower limits of the interval. It is a measure of the central value of the interval.
To calculate the midpoint of a class interval, use the following formula:
Midpoint = (Upper limit + Lower limit)/2
For example, if a class interval has an upper limit of 10 and a lower limit of 5, the midpoint would be calculated as follows:
Midpoint = (10 + 5)/2
Midpoint = 7.5
Determining the Central Value in a Frequency Distribution
The midpoint can be used to determine the central value of a frequency distribution. This is useful for comparing different frequency distributions or for identifying the central value of a data set.
To determine the central value of a frequency distribution using the midpoint, calculate the midpoint for each class interval and then multiply the midpoint by the frequency of the interval. Add up the products for all class intervals and divide by the total frequency.
The formula for calculating the central value of a frequency distribution using the midpoint is as follows:
Central value = (Sum of midpoint * frequency)/Total frequency
For example, consider the following frequency table:
| Class interval | Frequency | Midpoint |
|---|---|---|
| 0-10 | 2 | 5 |
| 11-20 | 3 | 15.5 |
| 21-30 | 4 | 25.5 |
| 31-40 | 5 | 35.5 |
| 41-50 | 6 | 45.5 |
To calculate the central value of the frequency distribution using the midpoint, we would first calculate the midpoint for each class interval:
Midpoint for 0-10 class interval = (10 + 5)/2 = 7.5
Midpoint for 11-20 class interval = (20 + 11)/2 = 15.5
Midpoint for 21-30 class interval = (30 + 21)/2 = 25.5
Midpoint for 31-40 class interval = (40 + 31)/2 = 35.5
Midpoint for 41-50 class interval = (50 + 41)/2 = 45.5
Next, we would multiply the midpoint of each class interval by the frequency of the interval and add up the products:
(7.5 * 2) + (15.5 * 3) + (25.5 * 4) + (35.5 * 5) + (45.5 * 6) = 444
Finally, we would divide the sum of the products by the total frequency to calculate the central value of the frequency distribution:
Central value = 444 / 20 = 22.2
Therefore, the central value of the frequency distribution using the midpoint is 22.2.
How to Find the Midpoint for Grouped Data
The midpoint of a class interval in grouped data is also calculated using the following formula:
Midpoint = (Upper limit + Lower limit)/2
For example, if we have a grouped data set with the following class intervals:
Class interval | Frequency
---|---|---|
0-10 | 2
11-20 | 3
21-30 | 4
31-40 | 5
41-50 | 6
The midpoint of the 0-10 class interval would be calculated as follows:
Midpoint = (10 + 5)/2 = 7.5
The midpoint of the 11-20 class interval would be calculated as follows:
Midpoint = (20 + 11)/2 = 15.5
And so on.
The midpoint can be a useful tool for understanding and analyzing frequency distributions. It can be used to determine the central value of a frequency distribution and to make comparisons between different frequency distributions.