What is an example of a variable?
Variables are a fundamental concept in mathematics, science, and computer programming. They represent quantities that can change or vary, and they play a crucial role in modeling real-world situations, solving problems, and making calculations. Let's unravel the concept of variables with examples and explore their significance:
Examples of Variables:
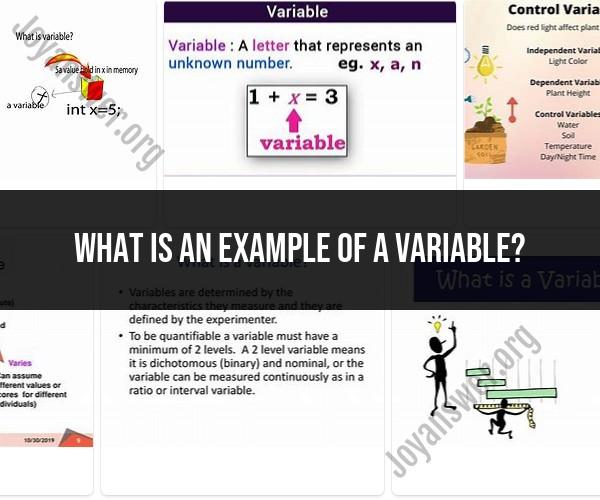
Mathematics: In an algebraic equation like "2x + 3 = 7," "x" is a variable representing an unknown value. It can take different values to satisfy the equation.
Science: In a physics experiment measuring the speed of a moving object, variables could include time, distance, and velocity. Changing these variables can help analyze how they affect the outcome.
Computer Programming: In programming, variables store data that can be used and manipulated. For example, a variable "temperature" could store the current temperature value, which can be updated as needed.
Significance of Variables:
Modeling Real-World Scenarios: Variables allow us to represent real-world situations mathematically or computationally. They enable us to analyze and predict outcomes, such as calculating the trajectory of a projectile or predicting population growth.
Problem Solving: Variables are essential for solving equations and mathematical problems. They help us find solutions by setting up equations and manipulating them to find the unknown values.
Scientific Experiments: Scientists use variables to design experiments and investigate cause-and-effect relationships. By changing one variable while keeping others constant, they can observe the impact on the outcome.
Data Storage and Manipulation: In computer programming, variables store various types of data, such as numbers, text, or Boolean values. This data can be used in calculations, decision-making, and generating outputs.
Algorithm Design: Variables are key components in algorithm design. They store intermediate results and allow the algorithm to perform complex tasks step by step.
Statistical Analysis: Variables are used to collect and analyze data. Different types of variables (independent, dependent, categorical, numerical) help researchers draw meaningful conclusions.
Customization and Adaptation: Variables enable customization in various applications. For instance, changing variables can modify the behavior of a program or adjust settings to suit different preferences.
Communication and Documentation: Variables provide a common language for communication among mathematicians, scientists, and programmers. They help document and share mathematical and computational concepts.
In essence, variables are versatile tools that bridge the gap between the abstract world of mathematics and the practical realm of real-world problems. They allow us to explore, analyze, and understand the dynamic nature of quantities, making them an essential concept in various fields of study and application.