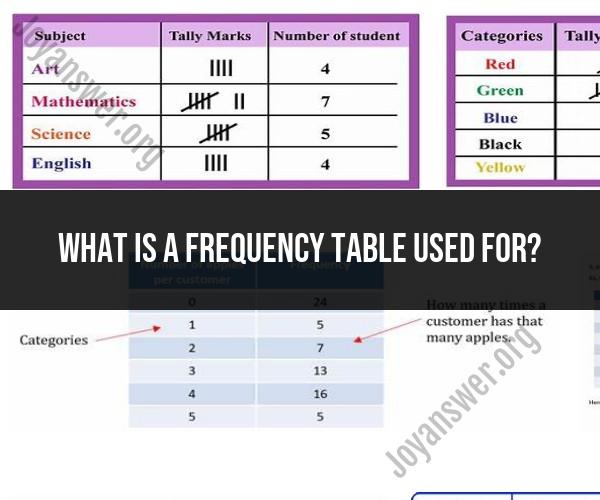
What is a frequency table used for?
A frequency table is a statistical tool used for organizing and summarizing data in a structured format. It displays the frequency or count of each unique value or category in a dataset, making it easier to understand the distribution of data. Frequency tables serve several important purposes in data organization and analysis:
Data Summarization: Frequency tables provide a concise summary of a dataset by showing the number of occurrences of each unique value or category. This simplifies complex datasets and highlights patterns.
Data Exploration: They help analysts explore the distribution of data and identify patterns, outliers, or unusual values. This can be particularly useful in data preprocessing and initial data exploration.
Frequency Distribution: Frequency tables display the distribution of data, showing which values are more or less common. This information is crucial for understanding the central tendency and spread of data.
Categorical Data Analysis: Frequency tables are commonly used to analyze categorical data, such as survey responses, product categories, or demographic information. They provide insights into the distribution of categories and can be used to calculate percentages.
Histogram Construction: Frequency tables are often used as a basis for constructing histograms, which are graphical representations of the frequency distribution of continuous data. Histograms provide a visual depiction of data distribution.
Decision-Making: In various fields, including business and healthcare, frequency tables help decision-makers assess the distribution of outcomes or events. For example, a healthcare provider might use a frequency table to track the incidence of specific diseases among patients.
Statistical Analysis: Frequency tables are used as input for various statistical analyses, such as chi-square tests, contingency tables, and hypothesis testing. They help determine whether observed patterns are statistically significant.
Data Cleaning: Frequency tables can reveal missing values or anomalies in datasets. Analysts can spot irregularities by comparing the expected frequencies to the observed frequencies.
Reporting: Frequency tables are commonly used in research reports, presentations, and data-driven storytelling. They provide a clear and concise way to present data to stakeholders.
Cross-Tabulation: In cross-tabulation (also known as contingency tables), frequency tables are used to analyze the relationship between two or more categorical variables. They help identify associations and dependencies between variables.
Overall, frequency tables are a fundamental tool in data analysis, providing a structured way to organize and understand data, especially when dealing with categorical or discrete data. They serve as a foundation for more advanced statistical analyses and data visualization techniques.
The Purpose and Uses of a Frequency Table
A frequency table is a table that shows the distribution of values in a data set. It is a simple but effective way to organize and analyze data. Frequency tables can be used to:
- Identify the most common and least common values in a data set
- Identify patterns and trends in the data
- Make comparisons between different data sets
Frequency tables are used in a variety of fields, including statistics, mathematics, business, and science. They can be used to analyze data from a variety of sources, such as surveys, experiments, and observational studies.
Understanding the Role of Frequency Tables in Data Analysis
Frequency tables play an important role in data analysis by helping to organize and summarize data. This can make it easier to identify patterns and trends in the data, and to make comparisons between different data sets.
For example, a frequency table could be used to analyze the results of a student survey. The table could show the number of students who received each grade on the survey. This information could then be used to identify the most common grades, as well as any patterns or trends in the grades.
Frequency tables can also be used to compare different data sets. For example, a frequency table could be used to compare the test scores of two different classes of students. This information could then be used to identify the class with the higher average test score, as well as any other differences between the two classes.
How Frequency Tables Help Organize and Analyze Data
Frequency tables help to organize and analyze data by providing a clear and concise way to summarize the data. The table shows the number of times each value appears in the data set, which can make it easier to identify patterns and trends in the data.
To create a frequency table, the first step is to list all of the unique values in the data set. Then, the number of times each value appears in the data set is counted. This information is then entered into the frequency table.
The frequency table can then be used to analyze the data by looking for patterns and trends. For example, if the frequency table shows that a particular value appears much more often than other values, then this indicates that the value is more common in the data set.
Frequency tables can also be used to make comparisons between different data sets. For example, if two frequency tables are compared, then any differences between the two data sets can be identified.
Overall, frequency tables are a valuable tool for organizing and analyzing data. They can be used to identify patterns and trends in the data, and to make comparisons between different data sets.