How do I change the chart settings in Yahoo Finance?
Yahoo Finance provides a variety of customization options for its financial charts. Here are the steps to change the chart settings in Yahoo Finance:
Visit Yahoo Finance:
- Open your web browser and go to the Yahoo Finance website at https://finance.yahoo.com.
Search for a Stock or Index:
- In the search bar at the top of the page, enter the name or symbol of the stock, index, or financial instrument you want to view.
Access the Chart:
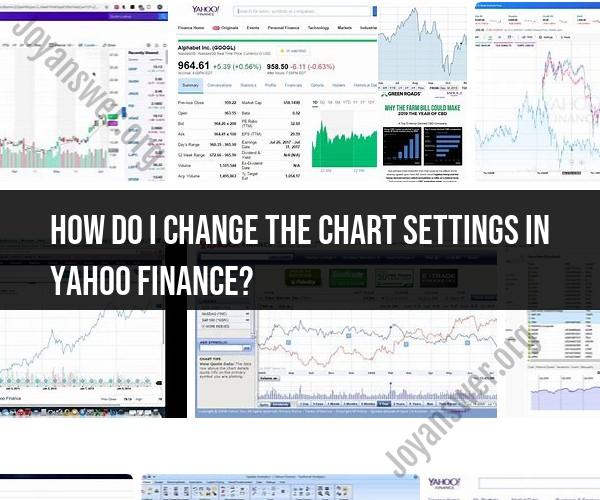
- Once you're on the stock's overview page, scroll down to the "Chart" section. You will see an interactive chart displaying the stock's historical price data.
Customize the Chart:
- To customize the chart, click on the "Settings" icon (usually looks like a gear or a settings cogwheel) located near the top right corner of the chart.
Adjust Chart Settings:
- In the settings menu, you can make various adjustments to the chart's appearance and data. Here are some common customization options:
- Time Period: Choose the time frame for the chart (e.g., 1 day, 5 days, 1 month, 1 year, etc.).
- Chart Type: Select the type of chart (e.g., line chart, candlestick chart, OHLC chart).
- Indicators: Add technical indicators like moving averages, Bollinger Bands, RSI, etc.
- Comparisons: Compare the stock's performance to other stocks or indices.
- Events: Overlay events like earnings releases, dividends, and splits.
- Scale: Choose between linear and logarithmic scales.
- Chart Size: Adjust the size of the chart.
- Chart Style: Change the color scheme and style of the chart.
- Show Volume: Toggle the display of trading volume on the chart.
- In the settings menu, you can make various adjustments to the chart's appearance and data. Here are some common customization options:
Apply Changes:
- After making your desired customizations, click the "Done" or "Apply" button to apply the changes to the chart.
Explore Additional Features:
- Yahoo Finance offers additional features like drawing tools, chart comparisons, and the ability to save customized chart layouts. Explore these features to further enhance your chart analysis.
Save or Share the Chart:
- If you want to save or share the customized chart, you can use the options provided by Yahoo Finance.
If you encounter any issues or need help with specific customization options, refer to the Yahoo Finance Help Center or explore the on-site resources for the most up-to-date information and guidance.