What is the Zacks database?
The Zacks Investment Research database is a comprehensive resource used by investors, analysts, and financial professionals to access various financial data, research reports, stock recommendations, and quantitative models. It's a vast repository of information that aids in making informed investment decisions.
Here are some key features and components of the Zacks database:
Earnings Estimates: Zacks is known for its earnings estimates, providing forecasts for earnings per share (EPS) for thousands of publicly traded companies. These estimates are valuable for analysts and investors in assessing the potential performance of companies.
Stock Ratings and Recommendations: The database offers stock ratings and recommendations based on various factors, including earnings surprises, valuation metrics, and analyst insights.
Research Reports: Users can access in-depth research reports covering various industries, sectors, and individual companies. These reports often include analysis, financial metrics, and forecasts.
Quantitative Models: Zacks employs proprietary quantitative models to assess stocks and predict their performance. These models may incorporate factors like earnings momentum, valuation metrics, and market trends.
Historical Data: The database contains historical financial data, including stock prices, revenues, earnings, and other fundamental metrics, allowing users to analyze past performance and trends.
Screening Tools: Users can filter and screen stocks based on specific criteria such as market cap, industry sector, valuation multiples, and financial ratios.
Education and Insights: Zacks often provides educational resources, articles, and insights to help users understand investing concepts, market trends, and strategies.
The Zacks database is widely used in the financial industry due to its comprehensive coverage of stocks, robust research tools, and quantitative models. Investors and analysts leverage this information to make well-informed investment decisions and to stay updated on market trends and developments.
What information and data are included in the Zacks database?
The Zacks database is a comprehensive collection of financial information and data for over 17,000 publicly traded companies in the United States. It covers a wide range of financial metrics, including:
- Company financials: This includes information such as revenue, earnings, cash flow, and balance sheet data.
- Analyst estimates: This includes earnings estimates, revenue estimates, and EPS estimates from a team of over 200 analysts.
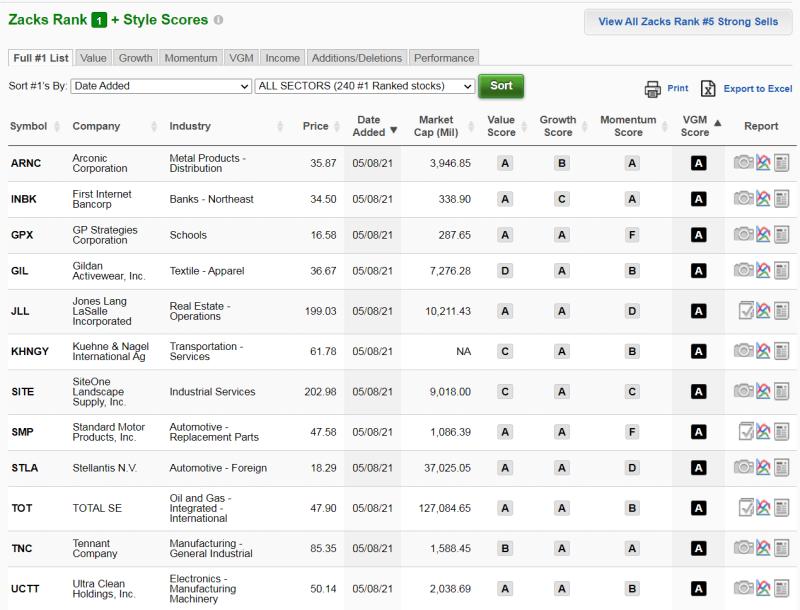
- Stock recommendations: This includes Zacks Rank, which is a proprietary rating system that predicts a stock's relative performance over the next 1-3-6-12 months.
- Industry data: This includes information on industry trends, competition, and economic conditions.
How is the Zacks database structured and accessed by users?
The Zacks database is structured in a way that allows users to easily access and analyze the information they need. The database is organized into several modules, including:
- Company information: This module provides a detailed overview of each company, including its history, business description, and management team.
- Financials: This module provides access to company financials, including historical and projected data.
- Estimates: This module provides access to analyst estimates, including earnings estimates, revenue estimates, and EPS estimates.
- Recommendations: This module provides access to Zacks Rank, as well as other stock recommendations.
- Industry data: This module provides access to information on industry trends, competition, and economic conditions.
Users can access the Zacks database through a variety of channels, including:
- Zacks.com: This is the main website for Zacks Investment Research.
- Zacks Investment Analyst: This is a software application that provides access to the Zacks database.
- Zacks API: This is an application programming interface (API) that allows developers to integrate Zacks data into their own applications.
What distinguishes the Zacks database from other financial databases?
The Zacks database is distinguished from other financial databases by several factors, including:
- Comprehensiveness: The Zacks database covers more companies and provides more comprehensive data than other financial databases.
- Accuracy: The Zacks database is known for its accuracy of financial data and analyst estimates.
- Timeliness: The Zacks database is updated daily, so users can always access the most up-to-date information.
- Ease of use: The Zacks database is designed to be easy to use, even for users with no prior experience with financial databases.
- Value: The Zacks database is a valuable tool for investors of all levels of experience.