How do you calculate the standard deviation?
The standard deviation is a measure of the amount of variation or dispersion in a set of values. To calculate the standard deviation, follow these steps:
Find the Mean (Average):
- Add up all the values in the data set and divide by the total number of values. This gives you the mean (μ).
Find the Differences from the Mean:
- For each value in the data set, subtract the mean (μ) from that value. These differences represent how much each value deviates from the mean.
Square the Differences:
- Square each of the differences obtained in the previous step. This is done to eliminate negative values and emphasize differences from the mean.
Find the Mean of the Squared Differences:
- Calculate the mean (average) of the squared differences obtained in the previous step.
Take the Square Root:
- Finally, take the square root of the mean of the squared differences. This gives you the standard deviation (σ).
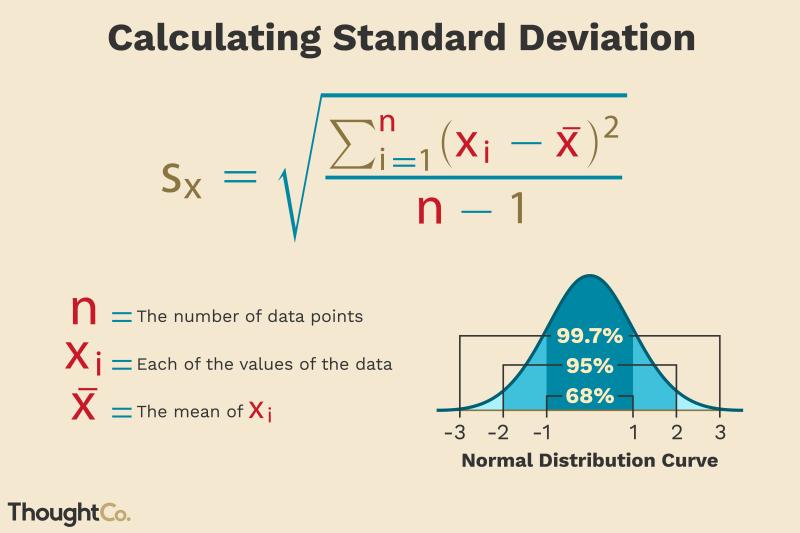
Mathematically, the formula for calculating the sample standard deviation (s) for a data set with 'n' values is:
Where:
- = each individual value in the data set
- = mean (average) of the data set
- = summation (addition of all values)
- = number of values in the data set
This formula calculates the sample standard deviation. If you have the entire population's data, you would divide by 'n' instead of 'n - 1' to get the population standard deviation.
Using statistical software or calculators with standard deviation functions can simplify this process when dealing with larger data sets or complex calculations.
What principles and steps are involved in computing standard deviation?
Standard deviation is a measure of the dispersion or variability of a dataset. It represents the average distance between each data point and the mean, or average, of the dataset. Standard deviation is a useful tool for understanding the spread of data and identifying outliers.
Principles of Computing Standard Deviation:
Variation: Standard deviation measures the amount of variation or dispersion within a dataset. A high standard deviation indicates that the data points are spread out over a wider range, while a low standard deviation suggests that the data points are clustered closely together around the mean.
Mean: The mean, or average, of the dataset serves as the central point from which the distances of individual data points are calculated. The standard deviation reflects the average deviation from the mean.
Normal Distribution: Standard deviation is particularly relevant for normally distributed data, which follows a bell-shaped curve. In a normal distribution, approximately 68% of the data points fall within one standard deviation of the mean, 95% within two standard deviations, and 99.7% within three standard deviations.
Steps in Computing Standard Deviation:
- Calculate the Mean (μ): Add up all the data points in the dataset and divide by the total number of data points (n).
Mean (μ) = Σx_i / n
- Calculate the Squared Deviations from the Mean: For each data point (x_i), subtract the mean (μ) and square the result.
Squared Deviation = (x_i - μ)^2
- Sum the Squared Deviations: Add up all the squared deviations from the mean.
Σ(x_i - μ)^2
- Calculate the Variance (σ^2): Divide the sum of squared deviations by the total number of data points (n).
Variance (σ^2) = Σ(x_i - μ)^2 / n
- Calculate the Standard Deviation (σ): Take the square root of the variance.
Standard Deviation (σ) = √(Σ(x_i - μ)^2 / n)