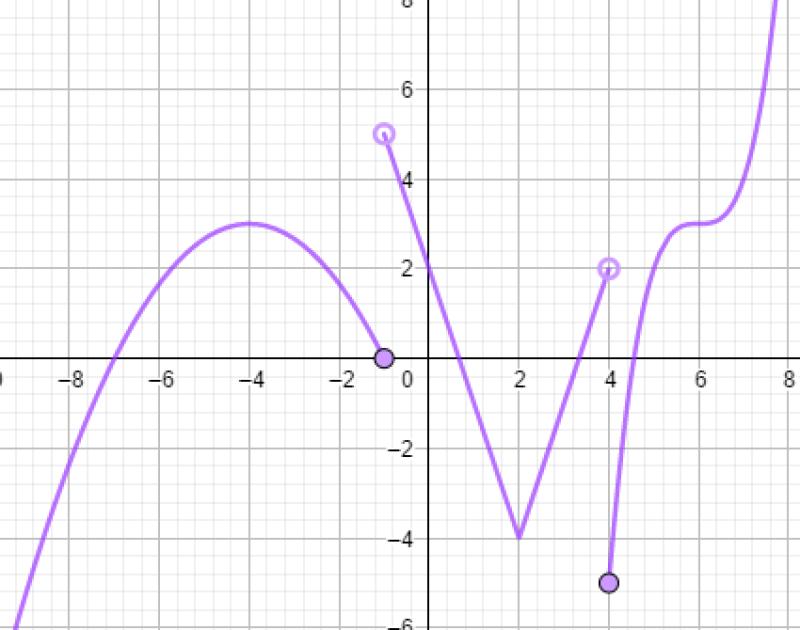
How to plot a piecewise in MATLAB?
Plotting a piecewise function in MATLAB involves breaking down the function into its separate parts and defining each part within the plotting code. Here's a step-by-step guide:
Step 1: Define the Piecewise Function
Let's consider an example of a piecewise function:
Step 2: Create the MATLAB Code
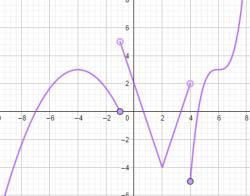
% Define the range of x values
x1 = linspace(-2, 0, 100); % Range for x < 0
x2 = linspace(0, 2, 100);  % Range for x >= 0

% Define the function for each range
y1 = x1.^2;               % Function for x < 0
y2 = 2 * x2 + 1;          % Function for x >= 0

% Plot the piecewise function
figure;
plot(x1, y1, 'r'); % Plot for x < 0 in red
hold on;           % Hold the plot for multiple functions
plot(x2, y2, 'b'); % Plot for x >= 0 in blue

% Customize plot labels and title
xlabel('x');
ylabel('f(x)');
title('Piecewise Function: f(x) = x^2 for x < 0, f(x) = 2x + 1 for x >= 0');

% Add legend and grid
legend('x^2 for x < 0', '2x + 1 for x >= 0');
grid on;

% Optionally, add markers to highlight the transition point at x = 0
plot(0, 0, 'ko'); % Black circle marker at x = 0, y = 0
Explanation:
linspaceis used to generate a range of x values for both intervals (-2 to 0 and 0 to 2).- The functions
y1andy2are defined based on the conditions given for each interval. plotis used to plot each part of the piecewise function separately, specifying different colors or markers for clarity.xlabel,ylabel,title,legend, andgridare used to label and customize the plot.- Optionally, a marker is placed at the point of transition (x = 0) using
plotwith a black circle marker ('ko').
Running the Code:
- Copy and paste the code into a MATLAB script or the MATLAB command window.
- Run the script.
- The plot representing the piecewise function with two separate parts for and will be displayed.
Adjust the ranges and functions based on your specific piecewise function to plot it accurately in MATLAB.
Understanding the concept of piecewise functions and their applications
Piecewise functions are a type of mathematical function that is defined by different expressions for different intervals of the input variable. This means that the behavior of the function changes depending on the value of the input variable. Piecewise functions are often used to represent phenomena that exhibit different characteristics in different ranges of the independent variable.
Applications of Piecewise Functions:
Modeling real-world scenarios: Piecewise functions can effectively model various real-world situations where the relationship between the input and output variables is not continuous or uniform. For instance, piecewise functions can be used to represent:
- Tax brackets: The amount of tax paid as a function of taxable income
- Pricing schemes: The cost of services or products based on usage or quantity
- Discount structures: The price of items based on purchase amount or customer loyalty
Simplifying complex functions: Piecewise functions can be used to simplify complex functions by breaking them down into easier-to-understand segments. This can make it easier to analyze and interpret the behavior of the function.
Approximating non-linear functions: Piecewise functions can be used to approximate non-linear functions by constructing segments that closely match the curve of the original function. This can be useful for applications where computational efficiency is critical.
Defining piecewise functions using MATLAB's conditional statements
MATLAB provides conditional statements like if-else and switch-case to define piecewise functions. These statements allow for defining different expressions for different conditions.
Example:
function y = piecewiseFunction(x)

if x < 0
    y = -x;
elseif x < 2
    y = 2*x;
else
    y = 3;
end

end
In this example, the piecewiseFunction function takes an input x and returns its corresponding output y based on the value of x.
Plotting piecewise functions using MATLAB's plotting functions
MATLAB provides various plotting functions like plot, fplot, and ezplot to visualize piecewise functions. These functions can generate graphs of the function over specified intervals.
Example:
x = -2:0.1:4;
y = piecewiseFunction(x);

plot(x, y);
This code generates a plot of the piecewiseFunction over the interval [-2, 4].
Formatting and customizing the appearance of piecewise function plots
MATLAB offers various options for formatting and customizing the appearance of piecewise function plots. These options include:
Line styles: Changing the line style (solid, dashed, dotted) for different segments of the function
Colors: Assigning different colors to represent different intervals of the function
Marker styles: Using different marker styles (circles, squares, triangles) for specific points on the function
Labels and titles: Adding labels to the axes and a title to the plot for better understanding
Analyzing and interpreting piecewise function plots to extract meaningful information
Analyzing and interpreting piecewise function plots involves examining the function's behavior and identifying key characteristics. This includes:
Locating the points of transition: Identifying the points where the function's behavior changes
Determining the amplitude and period (if applicable): For sinusoidal piecewise functions, identifying the amplitude (vertical stretch) and period (horizontal stretch) of each segment
Recognizing patterns and relationships: Identifying any patterns or relationships between the function's behavior and the input variable
Extracting meaningful insights: Drawing conclusions and insights from the observations made about the function's behavior