How do graph a linear equation on a graphing calculator?
Graphing linear equations on a graphing calculator is a straightforward process. Here's a step-by-step guide using a common graphing calculator, such as a TI-84:
Step 1: Turn on the Calculator
Ensure that your graphing calculator is turned on.
Step 2: Access the "Y=" Function
Press the "Y=" button to access the equation editor. This is where you'll input the linear equation.
Step 3: Input the Equation
Enter the linear equation into the "Y=" editor. The equation should be in the form "y = mx + b," where:
- "m" is the slope of the line,
- "x" is the variable,
- "b" is the y-intercept.
For example, if the equation is , enter it as follows:
- Press "2" and then "X,T,θ,n" to input "2x."
- Press "+."
- Press "3" to input "+ 3."
Step 4: Set the Window (Optional)
You may want to set the window to adjust the x and y-axis values. Press the "Window" button and input appropriate values for the x-min, x-max, y-min, and y-max. This step is optional, and you can skip it if you want the calculator to set the window automatically.
Step 5: Graph the Equation
After entering the equation, press the "Graph" button to plot the linear equation on the coordinate plane.
Step 6: Adjust the Window (If Necessary)
If the graph is not displayed well or if you want to explore a specific region of the graph, you can adjust the window settings. Press the "Window" button again and modify the values as needed.
Step 7: Trace the Graph (Optional)
You can use the "Trace" function to move along the graph and observe the coordinates at different points. Press the "Trace" button and use the arrow keys to navigate along the graph.
Step 8: Save or Print the Graph (Optional)
If you want to save or print the graph, some graphing calculators have options for capturing the screen or connecting to a printer.
Keep in mind that the specific steps might vary slightly depending on the model of your graphing calculator. Refer to your calculator's user manual for model-specific instructions if needed.
How to graph a linear equation on a graphing calculator, especially using Desmos
To graph a linear equation on a graphing calculator, follow these steps:
- Enter the linear equation in the calculator. For example, to graph the equation y = 2x + 1, you would enter the following into the calculator:
y=2x+1
- Set the calculator's viewing window to a range that includes the values you want to graph. For example, to graph the equation y = 2x + 1 from x = -2 to x = 2, you would set the calculator's viewing window to the following settings:
xmin=-2
xmax=2
ymin=-5
ymax=5
- Graph the equation by pressing the
GRAPHbutton.
Using Desmos to graph a linear equation
Desmos is a free online graphing calculator that can be used to graph linear equations and other types of functions. To graph a linear equation on Desmos, follow these steps:
- Go to the Desmos website: https://www.desmos.com/calculator
- Enter the linear equation in the Desmos calculator. For example, to graph the equation y = 2x + 1, you would enter the following into the calculator:
y=2x+1
- Press the
ENTERbutton.
Desmos will automatically graph the linear equation.
Steps and inputs involved in graphing a linear equation
The steps involved in graphing a linear equation are as follows:
- Enter the linear equation in the calculator.
- Set the calculator's viewing window to a range that includes the values you want to graph.
- Graph the equation by pressing the
GRAPHbutton.
The inputs involved in graphing a linear equation are the equation itself and the range of values that you want to graph.
How Desmos facilitates the process of graphing linear equations
Desmos makes it easy to graph linear equations by providing a user-friendly interface and automatic graphing capabilities. To graph a linear equation on Desmos, simply enter the equation in the calculator and press the ENTER button. Desmos will automatically graph the equation for you.
Common challenges or misconceptions related to graphing linear equations on a calculator
One common challenge when graphing linear equations on a calculator is setting the calculator's viewing window to a range that includes the values you want to graph. If you set the viewing window to a range that is too small, you may not be able to see the entire graph of the equation. If you set the viewing window to a range that is too large, the graph of the equation may be too small to see clearly.
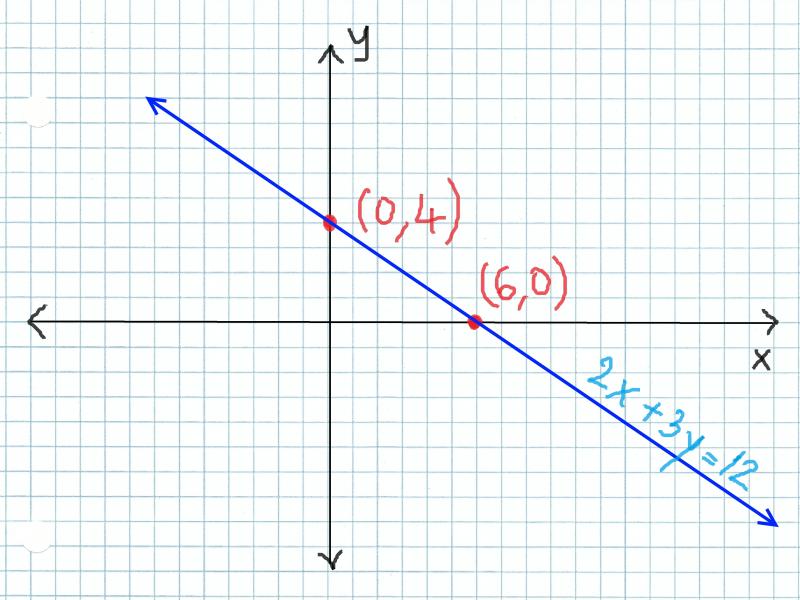
Another common challenge when graphing linear equations on a calculator is interpreting the graph. Once you have graphed the equation, you need to be able to interpret the graph to understand what it means. For example, you need to be able to identify the slope and y-intercept of the line.
Misconceptions
One common misconception about graphing linear equations on a calculator is that the calculator will do all of the work for you. This is not the case. You still need to understand what you are doing and be able to interpret the graph.
Another common misconception is that the calculator will always give you the correct answer. This is also not the case. If you make a mistake in entering the equation or setting the viewing window, the calculator will give you an incorrect answer.
Conclusion
Graphing linear equations on a calculator is a relatively easy task. By following the steps and using the tips above, you can accurately graph linear equations on your calculator.
