How to use the DESMOS graphing calculator tool?
Desmos is a powerful online graphing calculator tool that allows you to visualize and manipulate mathematical expressions, equations, and functions. Here's a guide on how to use the Desmos graphing calculator:
Basic Graphing:
Access the Desmos Calculator:
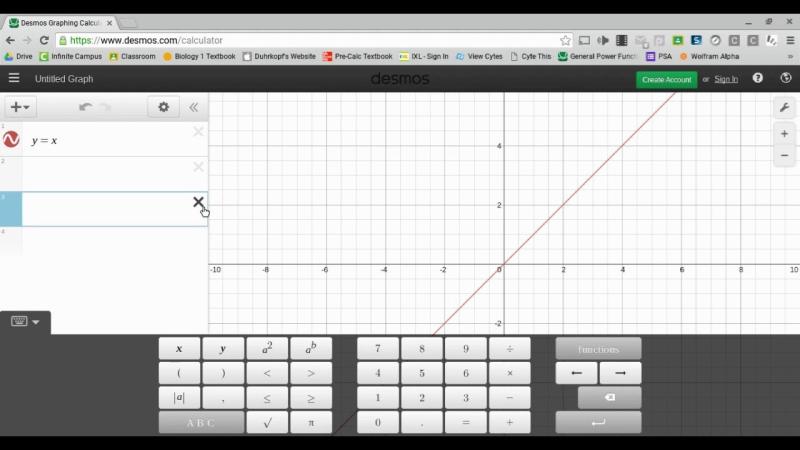
- Visit the Desmos website (https://www.desmos.com/calculator) to access the online graphing calculator.
Enter Equations:
- In the input bar at the top, enter your mathematical expressions or equations. For example, you can type "y = x^2" to graph a quadratic function.
Multiple Graphs:
- You can graph multiple equations on the same coordinate system by entering them one after another. Separate each equation with a comma.
Adjusting Parameters:
Zooming and Panning:
- Use your mouse or trackpad to drag the graph to pan, and use the scroll wheel or pinch gestures to zoom in and out.
Window Settings:
- Click on the wrench icon to access settings. You can manually set the x and y-axis ranges under "Window" for a more controlled view.
Features and Functions:
Table of Values:
- Click on the table icon to view a table of values for the graph. You can also input specific x and y values.
Slider for Variables:
- To explore the impact of changing a variable, add sliders. For example, type "a=1" and then use "a" as a slider by clicking on it.
Plotting Points:
- Click on the "+" icon to add points manually to the graph. You can use this feature to plot specific points or illustrate key values.
Labels and Annotations:
- Use the text tool to add labels and annotations to your graph. This is helpful for providing context or explanations.
Graph Settings:
- Customize the appearance of your graphs by clicking on the gear icon. You can change colors, line styles, and more.
Advanced Functions:
Implicit Equations:
- Desmos supports implicit equations. For example, you can graph the circle by typing it directly into the input bar.
Function Operations:
- Use standard function notation for operations like addition, subtraction, multiplication, and division. For example, type "(x+1)/(x-2)" to graph a rational function.
Saving and Sharing:
- Save and Share:
- If you want to save or share your graph, click on the share icon in the upper-right corner. This allows you to generate a link or download an image of your graph.
Troubleshooting:
Clear Graph:
- If you want to clear the graph and start fresh, click on the "trash can" icon.
Help and Documentation:
- If you need help or want to explore more advanced features, click on the question mark icon to access Desmos documentation and guides.
Desmos is an intuitive tool, and experimenting with different features will help you get comfortable with its capabilities. Whether you're a student, teacher, or anyone dealing with mathematical concepts, Desmos is a valuable resource for visualizing and understanding mathematical relationships.
How to use the Desmos graphing calculator tool for mathematical computations
To use the Desmos graphing calculator tool for mathematical computations, follow these steps:
- Go to the Desmos website: https://www.desmos.com/calculator
- In the Desmos calculator, enter the mathematical expression or equation that you want to compute.
- Press the
ENTERbutton.
Desmos will automatically compute the expression or equation and display the result.
Here are some examples of mathematical computations that you can perform using the Desmos graphing calculator:
- Arithmetic operations: Addition, subtraction, multiplication, and division
- Algebraic operations: Expanding and simplifying expressions, solving equations, and factoring polynomials
- Trigonometric functions: Sine, cosine, tangent, cotangent, secant, and cosecant
- Logarithmic functions: Log base 10 and log base e
- Exponential functions: e to the power of x
- Calculus operations: Finding derivatives and integrals
Functionalities and capabilities of the Desmos graphing calculator
The Desmos graphing calculator provides a wide range of functionalities and capabilities, including:
- Graphing functions: Desmos can graph a wide variety of functions, including linear functions, quadratic functions, polynomial functions, trigonometric functions, and exponential functions.
- Evaluating expressions: Desmos can evaluate any mathematical expression, including arithmetic expressions, algebraic expressions, trigonometric functions, and logarithmic functions.
- Solving equations: Desmos can solve a wide variety of equations, including linear equations, quadratic equations, polynomial equations, and trigonometric equations.
- Performing calculus operations: Desmos can find the derivatives and integrals of any mathematical function.
How the Desmos graphing calculator can assist with mathematical tasks
The Desmos graphing calculator can assist with a wide range of mathematical tasks, including:
- Graphing functions: Desmos can help you to visualize and understand how functions work.
- Evaluating expressions: Desmos can help you to evaluate complex mathematical expressions quickly and easily.
- Solving equations: Desmos can help you to solve difficult equations that would be difficult or impossible to solve by hand.
- Performing calculus operations: Desmos can help you to find the derivatives and integrals of complex mathematical functions.
Specific tips or tricks for optimizing the use of the Desmos graphing calculator
Here are some specific tips or tricks for optimizing the use of the Desmos graphing calculator:
- Use the keyboard shortcuts: Desmos provides a number of keyboard shortcuts that can help you to perform tasks quickly and easily. For example, you can press the
TABkey to switch between the input field and the output field, and you can press theCTRL+ENTERkeys to evaluate the current expression or equation. - Use the graph editor: The Desmos graph editor allows you to create custom graphs and animations. For example, you can use the graph editor to add points to a graph, to draw lines and shapes, and to label your graphs.
- Use the notes feature: The Desmos notes feature allows you to add notes to your graphs. This can be useful for explaining your work or for keeping track of your progress.
- Share your work: Desmos allows you to share your work with others. This can be useful for collaborating on projects or for getting help with your work.
Overall, the Desmos graphing calculator is a powerful and versatile tool that can be used to perform a wide range of mathematical tasks. By following the tips and tricks above, you can optimize the use of the Desmos graphing calculator and improve your mathematical skills.


