What is daily chart in stock market?
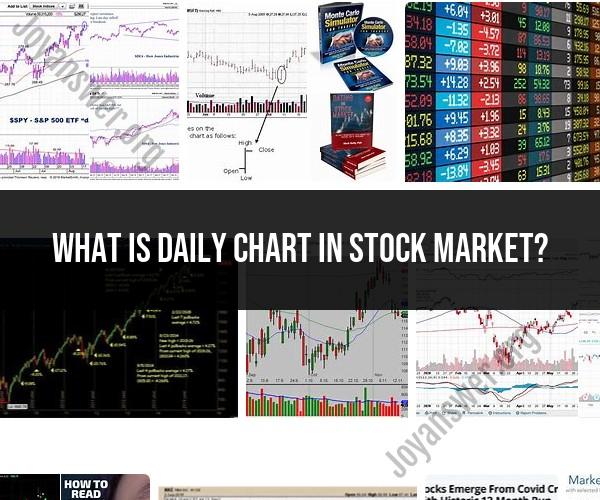
In the stock market, a daily chart is a graphical representation of price and trading activity for a particular stock or financial instrument over a single trading day. Each data point on the chart typically represents one trading day, and the chart provides a visual summary of how the stock's price moved during that day's trading session.
Here are some key characteristics and uses of daily charts in the stock market:
Timeframe: Daily charts display data for each trading day, which usually includes the opening price, closing price, high price, and low price for that day. The chart covers a specified period, such as one month, three months, one year, or longer, depending on the user's preferences.
Candlestick or Bar Format: Daily charts are often presented in candlestick or bar chart format. Candlestick charts provide visual cues about the stock's price movement, including the opening and closing prices, as well as intraday highs and lows.
Trends and Patterns: Daily charts are commonly used by traders and investors to identify trends and patterns in stock prices. For example, they can help identify uptrends (rising prices), downtrends (falling prices), or sideways consolidations. Traders may use technical analysis techniques to spot patterns and make trading decisions.
Support and Resistance Levels: Daily charts can reveal significant support and resistance levels where a stock's price has historically encountered buying or selling pressure. These levels can be used to set entry and exit points for trades.
Volatility Analysis: Daily charts provide insights into the stock's daily price range and volatility. Stocks with larger price swings are considered more volatile, which can present both opportunities and risks for traders.
Trading Strategies: Traders and investors use daily charts to implement various trading strategies, including day trading, swing trading, and long-term investing. The choice of strategy often depends on the timeframe represented by the daily chart.
Decision Making: Daily charts help traders and investors make informed decisions about buying, selling, or holding stocks. They provide historical context for price movements and can assist in forming expectations about future price movements.
Risk Management: Daily charts are an integral part of risk management in trading. They help traders set stop-loss orders and define risk-reward ratios for their trades.
Long-Term Analysis: While daily charts primarily focus on short-term price movements, they can also be used as building blocks for longer-term analysis. For example, daily data can be aggregated to create weekly or monthly charts, providing a broader perspective on price trends.
Overall, daily charts are valuable tools for anyone involved in stock market trading or investing. They offer a detailed view of price movements, which can be essential for making informed decisions and managing risks effectively in the dynamic world of financial markets. Traders and investors often use daily charts in conjunction with other technical and fundamental analysis tools to form a comprehensive view of a stock's potential.
Stock Market Basics: Understanding the Daily Chart
A daily stock chart is a graph that shows the price movement of a stock over the course of a single day. The chart typically displays the following information:
- Open price: The price at which the stock opened for trading on the day.
- High price: The highest price at which the stock traded during the day.
- Low price: The lowest price at which the stock traded during the day.
- Close price: The price at which the stock closed for trading on the day.
- Volume: The number of shares of the stock that were traded on the day.
Daily stock charts can be used to analyze a stock's price movements and identify trends. By studying the chart, investors can gain insights into the stock's supply and demand, as well as the overall sentiment in the market.
Analyzing Daily Stock Price Movements: A Guide for Investors
There are a number of different ways to analyze daily stock price movements. Here are a few tips:
- Identify trends: Look for patterns in the chart, such as a series of higher highs and higher lows (uptrend) or a series of lower highs and lower lows (downtrend).
- Support and resistance levels: Identify key support and resistance levels. Support levels are areas where the price is likely to find support and bounce back. Resistance levels are areas where the price is likely to encounter resistance and sell off.
- Volume: Pay attention to volume. Higher volume on up days indicates that there is strong buying pressure. Higher volume on down days indicates that there is strong selling pressure.
Using Daily Charts for Stock Market Analysis and Decision-Making
Daily stock charts can be used for a variety of different purposes, including:
- Identifying trading opportunities: Investors can use daily charts to identify potential trading opportunities, such as stocks that are breaking out of a trend or stocks that are approaching a key support or resistance level.
- Managing risk: Investors can use daily charts to manage their risk by setting stop-losses and exit targets.
- Making investment decisions: Investors can use daily charts to make informed investment decisions by analyzing the stock's price movements, trends, and support and resistance levels.
It is important to note that daily stock charts are just one tool that investors can use to make informed investment decisions. Investors should also consider other factors, such as the company's fundamentals, the overall market environment, and their own investment goals and risk tolerance.
Here are some additional tips for using daily charts for stock market analysis and decision-making:
- Use multiple time frames. Don't just rely on daily charts. Also look at weekly and monthly charts to get a better understanding of the stock's long-term trend.
- Use technical indicators. Technical indicators can be used to identify trends, momentum, and other patterns in the chart. However, it is important to use technical indicators in conjunction with other forms of analysis, such as fundamental analysis.
- Don't overtrade. Avoid trading too often. Instead, focus on finding a few good trading opportunities and sticking with them.
By following these tips, you can use daily stock charts to improve your stock market analysis and decision-making.