What is MACD?
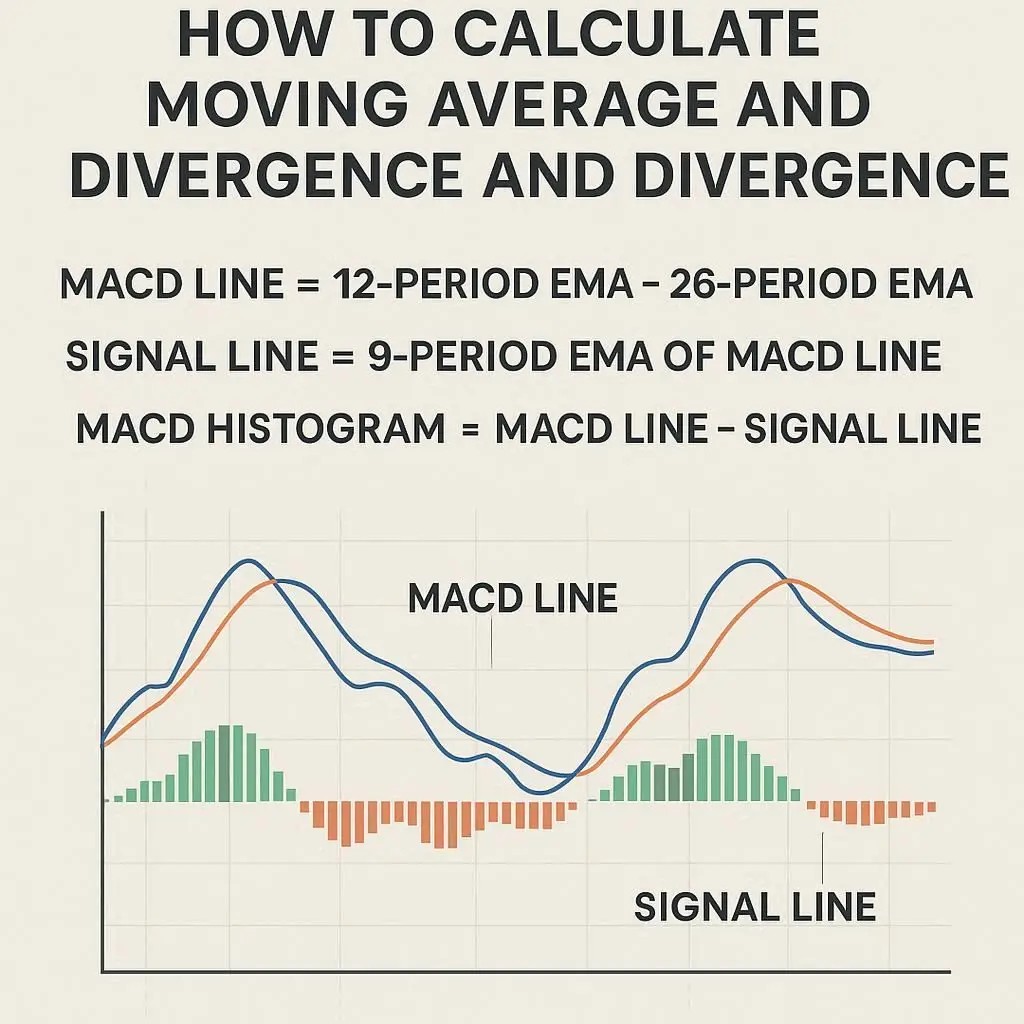
The Moving Average Convergence Divergence (MACD) is a popular trend-following momentum indicator that shows the relationship between two exponential moving averages (EMAs) of a security’s price. It consists of three main components which you can see in the chart below: the MACD Line, the Signal Line, and the Histogram.
How is MACD Calculated?
MACD is calculated in a series of steps using historical price data. The standard setting uses a 12-period EMA, a 26-period EMA, and a 9-period EMA for the signal line. Follow the interactive steps below to see how each component is derived from the original price.
Step 1: Calculate EMAs
First, we calculate the short-term (typically 12-period) and long-term (typically 26-period) Exponential Moving Averages (EMAs) of the closing prices.
Step 2: Calculate the MACD Line
The MACD line is the difference between the 12-period EMA and the 26-period EMA. MACD Line = 12-Period EMA - 26-Period EMA
Step 3: Calculate the Signal Line
The Signal Line is a 9-period EMA of the MACD Line itself. It acts as a trigger for buy and sell signals.
Step 4: Calculate the Histogram
The MACD Histogram is the difference between the MACD Line and the Signal Line. It visualizes the convergence and divergence of the two lines.Histogram = MACD Line - Signal Line
How to Interpret MACD Signals
Traders use MACD to identify potential buy and sell signals. The most common signals are crossovers, divergences, and rapid rises/falls of the histogram. Use the buttons below to highlight key signals on the chart and learn how they are interpreted.
Select a signal above to see an explanation and highlight it on the chart.
MACD vs. Other Indicators
While MACD is a powerful tool, it's a momentum indicator, not an all-in-one solution. Understanding its differences from other common indicators like the Relative Strength Index (RSI) and the Stochastic Oscillator is key to using it effectively.
MACD
Type: Trend-following momentum indicator.
Measurement: Shows the relationship between two EMAs. It is not range-bound, meaning it doesn't have a fixed upper or lower limit.
Best Use: Identifying trend direction and momentum. Crossovers can signal new trends.
RSI (Relative Strength Index)
Type: Momentum oscillator.
Measurement: Measures the speed and change of price movements. It is range-bound between 0 and 100.
Best Use: Identifying overbought (>70) and oversold (<30) conditions, primarily in range-bound or sideways markets.
Stochastic Oscillator
Type: Momentum oscillator.
Measurement: Compares a specific closing price to a range of its prices over time. It is also range-bound between 0 and 100.
Best Use: Similar to RSI, it identifies overbought (>80) and oversold (<20) levels, often providing signals earlier than RSI.
Advanced Topics & Limitations
MACD is versatile but has limitations. Understanding its application in different trading styles and its weaknesses in certain market conditions is crucial for successful analysis.
Use in Short-Term Trading
Yes, MACD can be used for day trading or scalping, but with adjustments. The standard (12, 26, 9) settings may be too slow. Short-term traders often use more sensitive settings (e.g., 5, 35, 5) to generate signals faster. However, this increases the number of false signals, so it should be combined with other analysis techniques.
Limitations in Choppy Markets
MACD's main weakness is in sideways or non-trending markets. Because it's a trend-following indicator, it can generate frequent, low-quality "whipsaw" signals (multiple crossovers in a short period) when there's no clear trend. This can lead to losses if not managed carefully. The chart shows how MACD performs in different market conditions.