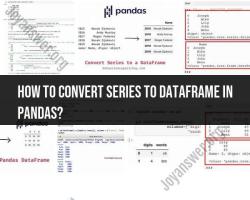
How to convert series to Dataframe in pandas?
Converting a Series to a DataFrame in Pandas is a common operation when working with data. Here's a step-by-step guide on how to do it:
Step 1: Import the pandas library
import pandas as pd
Step 2: Create a Series
data = pd.Series([10, 20, 30, 40, 50])
Step 3: Convert the Series to a DataFrame
df = data.to_frame()
Step 4 (Optional): Specify column namesIf your Series doesn't have a name or you want to specify column names, you can do so by passing the desired column name(s) as an argument.
df = data.to_frame(name='MyColumn')
Step 5 (Optional): Reset the indexBy default, the index of the Series will become the index of the DataFrame. If you want to reset the index and create a new numeric index, you can use the reset_index() method.
df.reset_index(drop=True, inplace=True)
Putting it all together:
import pandas as pd

# Step 2: Create a Series
data = pd.Series([10, 20, 30, 40, 50])

# Step 3: Convert the Series to a DataFrame
df = data.to_frame()

# Step 4 (Optional): Specify column names
df = data.to_frame(name='MyColumn')

# Step 5 (Optional): Reset the index
df.reset_index(drop=True, inplace=True)

print(df)
This will create a DataFrame from the given Series with an optional specified column name and a reset index. You can adjust the code based on your specific requirements and the structure of your data.
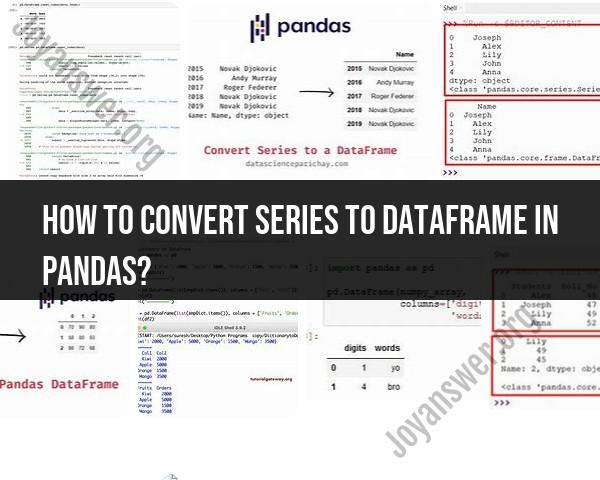
Converting Pandas Series to DataFrames: Methods and Benefits
Converting a Pandas Series to a DataFrame is a common data manipulation task. Here's how it works:
1. Conversion Process:
There are two main methods to convert a Series to a DataFrame:
a) Using to_frame():
This is the simplest method. Call the to_frame() method on the Series object. You can optionally specify a name for the column:
import pandas as pd

data = pd.Series([10, 20, 30], index=['A', 'B', 'C'])
df = data.to_frame(name='values')
print(df)
b) Using pd.DataFrame() constructor:
Pass the Series as an argument to the pd.DataFrame() constructor:
df = pd.DataFrame(data, columns=['values'])
print(df)
Both methods achieve the same result, creating a DataFrame with one column containing the Series data and the index (if present) becoming the row labels.
2. Different Methods:
While the above methods are most common, other options exist:
reset_index(): Prompts the Series index to become a new column in the DataFrame.- Concatenation: Concatenate the Series with an empty DataFrame.
- Dictionary conversion: Create a dictionary with the Series as a value and convert it to a DataFrame.
These methods offer slight variations in output or might be useful in specific situations.
3. Benefits of Conversion:
Converting Series to DataFrames offers several benefits for data manipulation and analysis:
- Enables labeling and indexing: DataFrames allow assigning column names and using labels for easier indexing and manipulation.
- Facilitates joins and merges: You can join or merge DataFrames with other DataFrames based on shared columns.
- Supports advanced operations: DataFrames enable various statistical operations, filtering, and transformations not directly applicable to Series.
- Improves data visualization: DataFrames are the preferred format for data visualization libraries like Matplotlib and Seaborn.
In essence, converting Series to DataFrames unlocks various data analysis possibilities and provides a more structured and flexible way to work with your data.