What are yield curves can an US Treasury have?
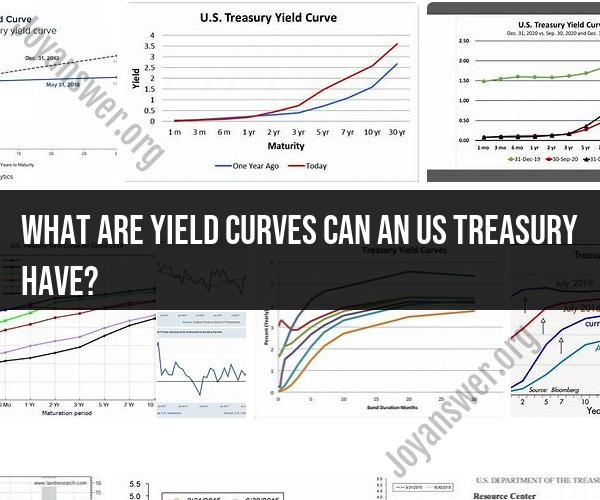
U.S. Treasury yield curves can take on several different shapes, depending on the relationship between the yields of Treasury securities with different maturities. Each shape conveys information about the current and future economic outlook. Here are the main types of yield curves that U.S. Treasuries can exhibit:
Normal Yield Curve:
- A normal yield curve is the most common shape, where longer-term Treasury securities have higher yields than shorter-term securities. In other words, the yield curve slopes upward from left (short-term) to right (long-term).
- Interpretation: A normal yield curve typically indicates expectations of economic expansion. Investors generally expect higher returns for tying up their money in longer-term investments. This curve reflects a healthy economy with normal interest rate expectations.
Flat Yield Curve:
- A flat yield curve occurs when the yields of Treasury securities across different maturities are roughly equal. Short-term and long-term yields are very close to each other.
- Interpretation: A flat yield curve may signal uncertainty or mixed expectations about future economic conditions. It can be a precursor to an economic transition, possibly from expansion to contraction or vice versa.
Inverted Yield Curve:
- An inverted yield curve is characterized by short-term Treasury securities having higher yields than longer-term securities. In other words, the yield curve slopes downward from left (short-term) to right (long-term).
- Interpretation: An inverted yield curve is often viewed as a potential warning sign of an impending economic recession. Historically, yield curve inversions have preceded recessions. When short-term yields exceed long-term yields, it may indicate that investors expect lower interest rates in the future, possibly due to economic concerns.
Steep Yield Curve:
- A steep yield curve occurs when there is a significant difference between short-term and long-term Treasury yields. Long-term yields are much higher than short-term yields.
- Interpretation: A steep yield curve may suggest expectations of strong economic growth. It can be an indicator of rising inflation expectations or the anticipation of central banks raising short-term interest rates in the future.
Humped Yield Curve:
- A humped yield curve features a temporary peak in the middle of the maturity spectrum, with short-term and long-term yields lower than intermediate-term yields.
- Interpretation: A humped yield curve can indicate uncertainty or mixed economic expectations. It may suggest that the market anticipates economic challenges in the near term but better prospects in the medium to long term.
It's important to note that yield curves are dynamic and can change over time based on economic data, market sentiment, and central bank policy decisions. Analysts and policymakers closely monitor yield curve dynamics as they provide valuable insights into the state of the economy and can influence investment and policy decisions.