How to graph residual?
Graphing residuals is a fundamental step in assessing the goodness of fit of a statistical model. Residuals represent the differences between the observed and predicted values in a regression analysis. Creating a residual plot helps you evaluate if the assumptions of your model are being met and if there's any pattern in the residuals that might indicate issues with the model.
Here are the steps to graph residuals:
Fit a Model: First, you need a statistical model (e.g., linear regression, polynomial regression) that you want to assess.
Calculate Residuals: Calculate the residuals by subtracting the predicted values from the actual observed values.
Create a Residual Plot:
- On the x-axis, plot the independent variable (or the predicted values if you're using multiple variables).
- On the y-axis, plot the residuals (the differences between the observed and predicted values).
Interpret the Residual Plot:
- Look for patterns in the residual plot. A good residual plot should ideally show randomness and should not exhibit any clear pattern.
- Patterns like a curved relationship, funnel shape, or any systematic increase or decrease in residuals as the predicted values change might suggest issues with the model.
Check for Homoscedasticity: A key aspect to examine is whether the spread of residuals remains roughly constant across different values of the independent variable. Homoscedasticity indicates that the variance of the residuals is constant.
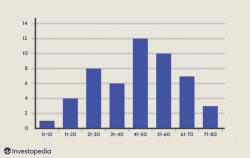
Assess Residuals' Distribution: Additionally, you can check if the residuals are normally distributed. You might create a histogram or a Q-Q plot of the residuals to assess this.
Remember, the absence of patterns in the residual plot doesn’t confirm the correctness of the model, but the presence of patterns can indicate potential problems that need further investigation.
Tools like statistical software (R, Python with libraries like Matplotlib, Seaborn) or even spreadsheet software like Excel can assist in creating residual plots.
Step-by-step guide to creating residual plots using statistical software
Residual plots are essential tools for evaluating the fit and assumptions of statistical models, such as linear regression models. They provide a visual representation of the differences between the observed data points and the predicted values from the model. Here's a step-by-step guide to creating residual plots using statistical software:
1. Import and Prepare Data:
Import your data into the statistical software of your choice.
Ensure the data is in a format suitable for analysis, with appropriate variable names, data types, and missing value handling.
2. Fit the Statistical Model:
- Depending on the specific model you're using, perform the appropriate model fitting procedure. For linear regression, use the 'lm' function in R or 'fitlm' function in Python's statsmodels library.
3. Generate Residuals:
- Extract the residuals from the fitted model. This can be done using the 'residuals' function in R or 'resid' attribute in Python's statsmodels library.
4. Create the Residual Plot:
Use the appropriate plotting function to create a scatter plot of the residuals against the independent variable (predictor variable).
Customize the plot to enhance its readability and effectiveness.
Customizing Residual Plots for Effective Visualization:
Ensure the plot has clear axes labels, titles, and appropriate scales for the residuals and the independent variable.
Consider adding gridlines to improve visibility.
For multiple observations, add a smoothing line to visualize the overall trend of the residuals.
Interpreting Residual Plots to Evaluate Model Fit:
Randomly scattered residuals around the zero line indicate a good model fit.
Non-random patterns, such as increasing or decreasing trends, suggest potential issues with the model or its assumptions.
Outliers, points far from the zero line, may indicate errors in the data or influential observations that require further investigation.
Troubleshooting Common Issues Encountered While Graphing Residuals:
If residuals appear clustered around specific values of the independent variable, consider adding interaction terms to the model.
If residuals show heteroscedasticity, unequal variance across the observations, consider using a weighted least squares regression or transforming the data.
If residuals exhibit non-linearity, consider using a non-linear model or transforming the variables.