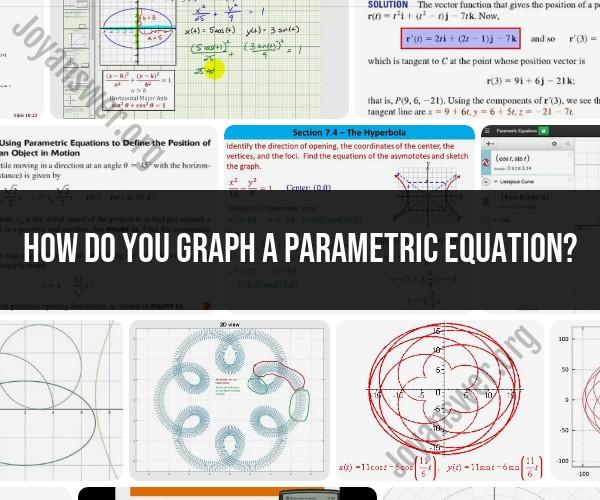
How do you graph a parametric equation?
Graphing parametric equations involves plotting points based on two separate equations, one for the x-coordinate and another for the y-coordinate, as a third variable (often represented as "t") changes. The steps below outline the process of graphing parametric equations:
Given Parametric Equations:
- x = f(t)
- y = g(t)
Steps for Graphing Parametric Equations:
Choose a Range for the Parameter (t): Determine the range of values for the parameter "t" over which you want to graph the equations. This range will dictate the portion of the curve you are interested in.
Select Values of "t": Choose several values of "t" within the chosen range. These values will be used to calculate corresponding x and y coordinates.
Calculate x and y Coordinates: For each selected value of "t," calculate the corresponding x and y coordinates using the given parametric equations:
- x = f(t)
- y = g(t)
Plot Points: Plot the calculated (x, y) points on a coordinate plane. Connect the points in the order they were calculated. This sequence of points will form the parametric curve.
Determine the Direction: Pay attention to the direction in which the curve is traced. This direction is typically determined by the order in which you calculate the points. It may be important, especially in physics or engineering contexts.
Label the Curve: If the parametric equations represent a specific curve (e.g., a circle, ellipse, or parabola), label the curve accordingly.
Add Contextual Information: Depending on the context of the problem or the nature of the curve, you may need to include additional information, such as the equation of a tangent line at a specific point or the orientation of the curve.
Scale the Axes: Ensure that the scale of the x and y axes is appropriate to represent the curve accurately. This may involve adjusting the range of the axes or using different scales for each axis.
Analyze the Curve: Once you have graphed the parametric equations, analyze the resulting curve. Look for key features, such as intersections, maxima, minima, or points of inflection, as needed for your specific problem.
Optional: Use Technology: You can also use graphing software or calculators capable of graphing parametric equations to visualize the curve more efficiently, especially for complex or time-consuming equations.
Remember that parametric equations are often used to describe curves that are not easily represented by a single Cartesian equation. The parameter "t" allows you to trace out the curve systematically, which can be especially useful in physics, engineering, and other fields where motion or change over time is involved.