How to graph parametrics?
Graphing parametric equations involves representing and visualizing the relationship between two or more variables in a coordinate system. Parametric equations are often used to describe curves and trajectories, and graphing them requires specific techniques and tools. Here's a step-by-step guide on how to graph parametric equations:
1. Understand Parametric Equations:
- Parametric equations describe the coordinates of a point in terms of one or more parameters (usually denoted as "t"). These equations are typically written as a set of equations, one for each coordinate (x and y, for example), in terms of the parameter "t."
- For example, a parametric equation for a point on a curve might be:
- x = f(t)
- y = g(t)
2. Choose a Range for the Parameter "t":
- Determine the range of values for the parameter "t" that you want to visualize. This range will determine the portion of the curve you'll graph.
3. Calculate Coordinate Pairs:
- Choose a set of values for "t" within the specified range. Calculate the corresponding x and y coordinates using the parametric equations. You may need to use a calculator or software that supports parametric equations for this step.
4. Create a Table of Values:
- Organize the calculated coordinate pairs (x, y) into a table. List the values of "t" and their corresponding (x, y) pairs in separate columns.
5. Plot the Points:
- Use graphing tools, such as graph paper, graphing software, or a graphing calculator, to plot the (x, y) coordinate pairs from your table. Each point corresponds to a specific value of "t."
6. Connect the Points:
- After plotting the points, connect them with a smooth curve to represent the graph of the parametric equations. The curve may represent the path of a moving object, a mathematical function, or some other relationship.
7. Label the Curve:
- If necessary, label the curve with its equation or any relevant information. Include any units or descriptions that provide context to the graph.
8. Adjust Parameters and Range (Optional):
- You can experiment with different parameter values and ranges to explore how the graph changes. This can help you understand the behavior of the curve under different conditions.
9. Consider Multiple Parametric Equations:
- In some cases, you may have multiple parametric equations that describe different aspects of the same curve, such as its x and y coordinates over time. You can graph these equations together to get a more comprehensive view of the curve's behavior.
10. Animate the Graph (Advanced):- Some graphing software allows you to animate parametric graphs by varying the parameter "t" continuously. This can provide dynamic visualizations of curves and trajectories.
11. Interpret the Graph:- Once you've graphed the parametric equations, analyze the graph to gain insights into the behavior and characteristics of the curve. Pay attention to features like intersections, symmetry, and any specific points of interest.
Graphing parametric equations can be a powerful tool for visualizing complex relationships and mathematical concepts. Utilizing graphing software or a graphing calculator can make the process more efficient, especially for parametric equations with numerous data points or complex curves.
Graphing Parametrics: A Comprehensive Guide
Parametric equations are a way of defining a curve by specifying its x- and y-coordinates as functions of a third parameter, t. This parameter can be thought of as time, but it can also be any other variable.
To graph a parametric curve, you can follow these steps:
- Choose a range of values for the parameter t.
- Calculate the x- and y-coordinates for each value of t.
- Plot the points (x, y) on a coordinate plane.
- Connect the points with a smooth curve.
Here is an example:
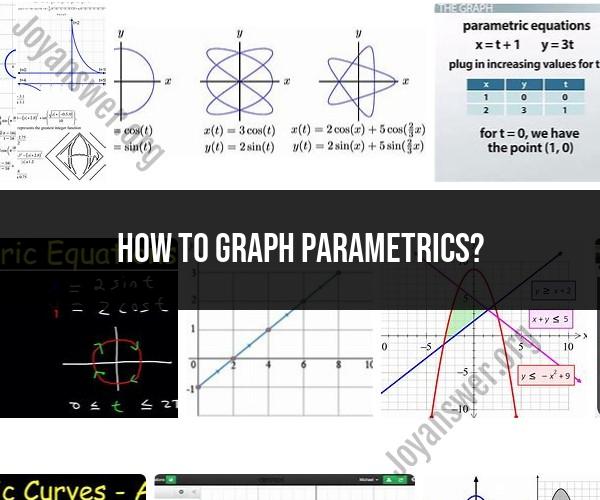
The following parametric equations define a circle:
x = cos(t)
y = sin(t)
To graph this circle, we can choose a range of values for t, such as from 0 to 2π. Then, we can calculate the x- and y-coordinates for each value of t using the equations above. For example, when t = 0, x = 1 and y = 0. When t = π/2, x = 0 and y = 1.
Once we have calculated the x- and y-coordinates for each value of t, we can plot the points on a coordinate plane. Finally, we can connect the points with a smooth curve to create a graph of the circle.
Visualizing Parametric Equations: How to Graph Them
There are a few things to keep in mind when graphing parametric equations:
- The direction of the curve is determined by the parameter t. Increasing values of t will usually cause the curve to move in the clockwise direction.
- The speed of the curve is also determined by the parameter t. A faster rate of change of t will result in a faster moving curve.
- Parametric curves can be open or closed. An open curve will continue to move forever, while a closed curve will eventually return to its starting point.
Step-by-Step Graphing of Parametric Functions
Here is a step-by-step guide to graphing parametric functions:
- Choose a range of values for the parameter t. This range can be anything you want, but it is usually best to choose a range that will produce a graph that is easy to interpret.
- Calculate the x- and y-coordinates for each value of t. This can be done by substituting the value of t into the parametric equations.
- Plot the points (x, y) on a coordinate plane. Be sure to label the x- and y-axes.
- Connect the points with a smooth curve. You may need to use a ruler or other straight edge to help you draw the curve.
Here is an example of how to graph the parametric equations for a circle using the steps above:
- Choose a range of values for the parameter t. We will choose a range of values from 0 to 2π.
- Calculate the x- and y-coordinates for each value of t. We can use the following equations:
x = cos(t)
y = sin(t)
For example, when t = 0, x = 1 and y = 0. When t = π/2, x = 0 and y = 1.
Plot the points (x, y) on a coordinate plane. We will use a coordinate plane with a range of -1 to 1 on both the x- and y-axes.
Connect the points with a smooth curve. We can use a ruler or other straight edge to help us draw the curve.
The resulting graph is a circle.
Parametric functions can be used to graph a variety of different curves, including circles, ellipses, parabolas, and hyperbolas. They can also be used to graph more complex curves, such as spirals and fractals.