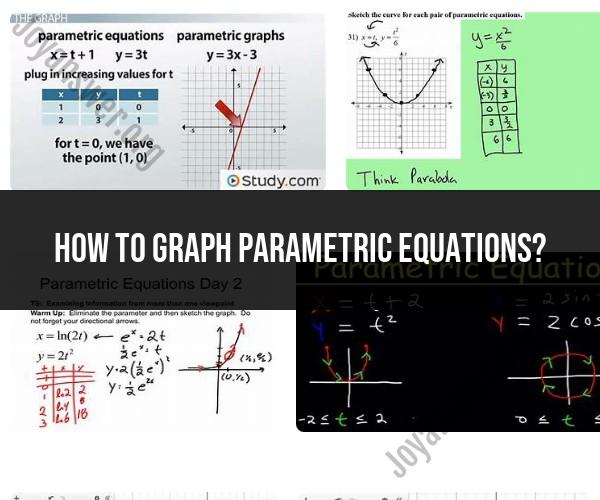
How to graph parametric equations?
Graphing parametric equations involves visualizing and plotting points on a coordinate plane based on the parametric equations provided. Parametric equations express the coordinates of points on a curve in terms of one or more parameters. To graph parametric equations, follow these steps:
1. Determine the Range of the Parameter(s): Identify the range or domain of the parameter(s) as specified in the problem or context. This range dictates the values over which you'll vary the parameter(s) to generate points on the curve.
2. Choose a Range for the Parameter(s): If the problem doesn't specify a range for the parameter(s), you can choose a suitable range based on your analysis or the nature of the curve. For example, if you're graphing a circle parameterized by the angle θ, you might choose θ to range from 0 to 2π to complete a full circle.
3. Select Parameter Values: Select specific values for the parameter(s) within the chosen range. These values will determine the points on the curve you want to plot. You can choose a set of values manually or use a numerical method or calculator to generate them.
4. Calculate Coordinates: For each chosen value of the parameter(s), calculate the corresponding x and y coordinates using the parametric equations. If there's a third parameter (z for 3D graphs), calculate it as well.
5. Plot Points: Plot the calculated points on a coordinate plane. Use the x and y (or x, y, and z for 3D graphs) values as the coordinates for each point. Place the points in the order they are generated to visualize the curve.
6. Connect Points: To get a smooth curve, connect the plotted points with a continuous line. This line represents the parametric curve. Ensure that the line doesn't have any breaks or discontinuities unless the parametric equations specify them.
7. Label the Graph: Label the axes, indicate the parameter(s) used, and provide any additional information relevant to the graph. This step is essential for clarity and interpretation.
8. Interpret the Curve: Examine the graph to understand the characteristics of the curve. Look for features such as symmetry, intersections with axes, maximum and minimum points, and any other relevant information.
9. Adjust Parameter Values: If you want to explore the behavior of the curve further, you can adjust the parameter values or range and replot the curve. This can help you understand how changes in the parameters affect the shape of the curve.
Example:Let's graph the parametric equations for a simple circle:
x = cos(θ)y = sin(θ)
We'll choose values of θ from 0 to 2π in increments of π/4. For each θ value, we calculate x and y and plot the points. Here are the points:
- θ = 0: (1, 0)
- θ = π/4: (√2/2, √2/2)
- θ = π/2: (0, 1)
- θ = 3π/4: (-√2/2, √2/2)
- θ = π: (-1, 0)
- θ = 5π/4: (-√2/2, -√2/2)
- θ = 3π/2: (0, -1)
- θ = 7π/4: (√2/2, -√2/2)
- θ = 2π: (1, 0)
Now, we connect these points, which results in a graph of a circle centered at the origin with a radius of 1.
Graphing parametric equations allows you to visualize complex curves and understand their behavior by systematically plotting points based on the parameter(s). It's a valuable tool for studying a wide range of mathematical and real-world phenomena.
Graphing Parametric Equations: Techniques and Examples
There are a number of different techniques for graphing parametric equations. Some of the most common techniques include:
- Point plotting: This is the simplest technique, and it involves plotting the points that correspond to different values of the parameter. For example, to graph the circle with radius r and center at (x0, y0), you would plot the points (x(t), y(t)) for t values ranging from 0 to 2π.
- Using a graphing calculator: Most graphing calculators can graph parametric equations. To graph a parametric equation on a graphing calculator, you will need to enter the equations for x(t) and y(t) into the calculator and then select the parametric graphing mode.
- Using a computer: There are a number of computer software programs that can graph parametric equations. To graph a parametric equation on a computer, you will need to enter the equations for x(t) and y(t) into the program and then select the parametric graphing mode.
Parametric Equations on a Graph: How to Plot Them
Here are the steps on how to plot parametric equations on a graph:
- Choose the values of the parameter t that you want to plot.
- Evaluate x(t) and y(t) for each value of t.
- Plot the points (x(t), y(t)) on the graph.
Visualizing Curves: Graphing Parametric Equations with Precision
To graph parametric equations with precision, it is important to choose a sufficient number of t values to plot. If you choose too few t values, the graph may not be accurate. If you choose too many t values, the graph may be cluttered.
A good rule of thumb is to choose at least 100 t values to plot. However, you may need to choose more t values if the curve is complex.
You can also use a graphing calculator or computer software to graph parametric equations with precision. These programs will automatically choose a sufficient number of t values to plot.
Examples
Here are some examples of how to graph parametric equations:
- To graph the circle with radius r and center at (x0, y0):
x(t) = r * cos(t) + x0
y(t) = r * sin(t) + y0
where t ranges from 0 to 2π.
- To graph the cycloid:
x(t) = a * (t - sin(t))
y(t) = a * (1 - cos(t))
where t ranges from 0 to 2π.
- To graph the four-leaf rose:
x(t) = a * cos(2t) * cos(t)
y(t) = a * cos(2t) * sin(t)
where t ranges from 0 to 2π.
These are just a few examples of how to graph parametric equations. There are many other types of parametric equations that can be graphed.
By mastering the art of graphing parametric equations, you will be able to visualize and understand a wide range of curves and mathematical relationships.