How can I calculate a standard score to percentile?
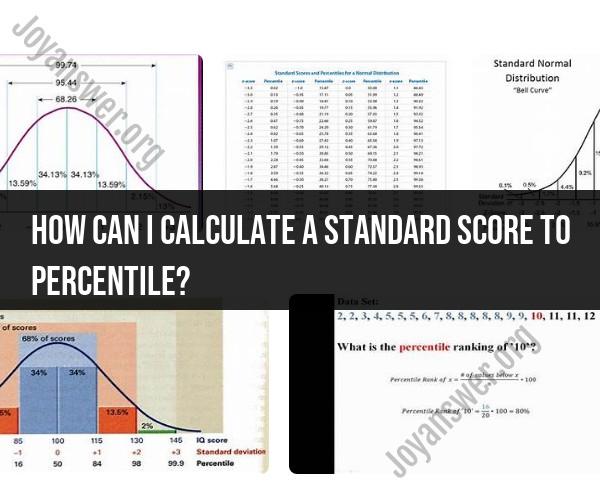
Converting a standard score (also known as a z-score) to a percentile involves determining the percentage of data points that fall below or above the given standard score in a normal distribution. A standard score represents how many standard deviations a data point is from the mean (average) in a normal distribution.
Here's the step-by-step process to calculate a percentile from a standard score:
Understand the Z-Score: First, ensure you have a valid standard score (z-score) for a specific data point. The standard score measures how many standard deviations a data point is from the mean. A positive z-score indicates that the data point is above the mean, while a negative z-score indicates that it's below the mean.
Find the Cumulative Probability: You'll need a standard normal distribution table or a calculator that can provide cumulative probabilities for the standard normal distribution. This table or calculator will give you the cumulative probability associated with the z-score.
Convert to Percentile: The cumulative probability from the standard normal distribution table represents the percentage of data points that fall below the given z-score. To convert this to a percentile (which represents the percentage of data points that fall at or below the given value), simply multiply the cumulative probability by 100.
Here's the formula to convert a z-score to a percentile:
Percentile = (Cumulative Probability from Z-Table) × 100
For example, if you have a z-score of 1.96 (which corresponds to the 97.5th percentile in a standard normal distribution table), you can calculate the percentile as follows:
Percentile = 0.975 × 100 = 97.5
So, a z-score of 1.96 is at the 97.5th percentile, meaning that 97.5% of the data falls at or below this score in a standard normal distribution.
If you don't have access to a standard normal distribution table or calculator, you can use software like Excel or statistical software packages to calculate the percentile directly from the z-score.
Keep in mind that this method assumes that your data follows a normal distribution. If your data is not normally distributed, the interpretation of percentiles may not be as straightforward, and other methods may be more appropriate.