What are the types of probability distribution?
There are several types of probability distributions in statistics, each with its own characteristics and applications. Here is a comprehensive overview of some of the most commonly encountered probability distributions:
Uniform Distribution: In a uniform distribution, all values within a specified range are equally likely. It forms a rectangular shape on a probability density graph.
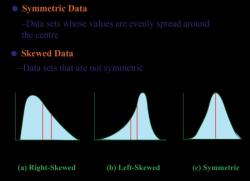
Normal Distribution (Gaussian Distribution): The normal distribution is often referred to as the "bell curve." It is symmetrical and characterized by a mean (average) and standard deviation. Many natural phenomena follow this distribution.
Binomial Distribution: The binomial distribution is used to model the number of successes in a fixed number of Bernoulli trials (binary experiments with two possible outcomes). It's characterized by parameters n (number of trials) and p (probability of success).
Poisson Distribution: The Poisson distribution describes the number of events that occur in a fixed interval of time or space. It's often used for modeling rare events with a known average rate.
Exponential Distribution: The exponential distribution models the time between events in a Poisson process. It's commonly used in reliability engineering and queuing theory.
Gamma Distribution: The gamma distribution is a family of continuous probability distributions that generalizes the exponential distribution. It's used to model waiting times and other positive continuous variables.
Weibull Distribution: The Weibull distribution is often used in reliability engineering to model the distribution of lifetimes or failure times. It can take on different shapes, including exponential and normal.
Log-Normal Distribution: The log-normal distribution arises when the natural logarithm of a variable follows a normal distribution. It's used for modeling variables that are inherently positive and skewed.
Chi-Square Distribution: The chi-square distribution is used in hypothesis testing, particularly in the context of chi-square tests. It's also used in estimating population variances.
Student's t-Distribution: The t-distribution is used for hypothesis testing when the sample size is small or when population standard deviation is unknown. It becomes closer to a normal distribution as the sample size increases.
F-Distribution: The F-distribution is used in statistical hypothesis testing, particularly in the analysis of variance (ANOVA) and regression analysis.
Geometric Distribution: The geometric distribution models the number of trials needed for the first success in a sequence of Bernoulli trials with the same probability of success.
Negative Binomial Distribution: The negative binomial distribution generalizes the geometric distribution to model the number of trials needed for r successes in a sequence of Bernoulli trials.
Hypergeometric Distribution: The hypergeometric distribution models the probability of drawing a specific number of successes from a finite population without replacement. It's used in sampling without replacement scenarios.
Multinomial Distribution: The multinomial distribution generalizes the binomial distribution to scenarios with more than two categories or outcomes.
These are some of the fundamental probability distributions encountered in statistics and probability theory. The choice of distribution depends on the nature of the data and the specific problem being analyzed. Understanding these distributions is essential for making accurate statistical inferences and modeling various real-world phenomena.
There are several types of probability distributions in statistics, each with its own characteristics and applications. Here is a comprehensive overview of some of the most commonly encountered probability distributions:
Uniform Distribution: In a uniform distribution, all values within a specified range are equally likely. It forms a rectangular shape on a probability density graph.
Normal Distribution (Gaussian Distribution): The normal distribution is often referred to as the "bell curve." It is symmetrical and characterized by a mean (average) and standard deviation. Many natural phenomena follow this distribution.
Binomial Distribution: The binomial distribution is used to model the number of successes in a fixed number of Bernoulli trials (binary experiments with two possible outcomes). It's characterized by parameters n (number of trials) and p (probability of success).
Poisson Distribution: The Poisson distribution describes the number of events that occur in a fixed interval of time or space. It's often used for modeling rare events with a known average rate.
Exponential Distribution: The exponential distribution models the time between events in a Poisson process. It's commonly used in reliability engineering and queuing theory.
Gamma Distribution: The gamma distribution is a family of continuous probability distributions that generalizes the exponential distribution. It's used to model waiting times and other positive continuous variables.
Weibull Distribution: The Weibull distribution is often used in reliability engineering to model the distribution of lifetimes or failure times. It can take on different shapes, including exponential and normal.
Log-Normal Distribution: The log-normal distribution arises when the natural logarithm of a variable follows a normal distribution. It's used for modeling variables that are inherently positive and skewed.
Chi-Square Distribution: The chi-square distribution is used in hypothesis testing, particularly in the context of chi-square tests. It's also used in estimating population variances.
Student's t-Distribution: The t-distribution is used for hypothesis testing when the sample size is small or when population standard deviation is unknown. It becomes closer to a normal distribution as the sample size increases.
F-Distribution: The F-distribution is used in statistical hypothesis testing, particularly in the analysis of variance (ANOVA) and regression analysis.
Geometric Distribution: The geometric distribution models the number of trials needed for the first success in a sequence of Bernoulli trials with the same probability of success.
Negative Binomial Distribution: The negative binomial distribution generalizes the geometric distribution to model the number of trials needed for r successes in a sequence of Bernoulli trials.
Hypergeometric Distribution: The hypergeometric distribution models the probability of drawing a specific number of successes from a finite population without replacement. It's used in sampling without replacement scenarios.
Multinomial Distribution: The multinomial distribution generalizes the binomial distribution to scenarios with more than two categories or outcomes.
These are some of the fundamental probability distributions encountered in statistics and probability theory. The choice of distribution depends on the nature of the data and the specific problem being analyzed. Understanding these distributions is essential for making accurate statistical inferences and modeling various real-world phenomena.
Exploring Probability Distributions: Different Types and Their Uses
Probability distributions are mathematical functions that describe the probabilities of different events happening. There are many different types of probability distributions, each with its own unique characteristics and uses.
Here are some of the most common types of probability distributions:
- Binomial distribution: The binomial distribution is used to model events that have two possible outcomes, such as flipping a coin or rolling a die.
- Normal distribution: The normal distribution is also known as the bell curve. It is a symmetrical distribution that is used to model many different types of data, such as human height and IQ scores.
- Poisson distribution: The Poisson distribution is used to model events that occur at a constant rate, such as the number of goals scored in a soccer game or the number of customers who visit a store in a day.
- Exponential distribution: The exponential distribution is used to model the time between events, such as the time between car accidents or the time it takes for a light bulb to burn out.
Other common types of probability distributions include the uniform distribution, the chi-squared distribution, and the t-distribution.
Diving into Probability: Understanding Various Distribution Types
Each type of probability distribution has its own unique characteristics and uses. For example, the binomial distribution is often used to calculate the probability of winning a lottery or getting a certain number of heads on a coin toss. The normal distribution is often used to calculate the probability of a student getting a certain grade on an exam or a patient having a certain disease. The Poisson distribution is often used to calculate the probability of a certain number of customers visiting a store in a day or a certain number of cars passing through an intersection in an hour.
The Spectrum of Probability Distributions: A Comprehensive Overview
The spectrum of probability distributions is vast and complex. There are many different types of probability distributions, each with its own unique characteristics and uses.
Some probability distributions are simple and easy to understand, such as the binomial distribution. Other probability distributions are more complex and require advanced mathematical knowledge to understand, such as the multivariate normal distribution.
No matter what your level of mathematical expertise, there is a probability distribution that can be used to model the data you are interested in.
Here are some examples of how different types of probability distributions are used in practice:
- A bank might use the binomial distribution to calculate the probability of a customer defaulting on a loan.
- An insurance company might use the normal distribution to calculate the probability of a customer's house being damaged by a fire.
- A manufacturer might use the Poisson distribution to calculate the probability of a certain number of defects occurring in a batch of products.
- A scientist might use the exponential distribution to calculate the probability of a certain reaction occurring in a chemical experiment.
Probability distributions are a powerful tool for modeling and understanding the world around us. They have a wide range of practical applications in many different fields.