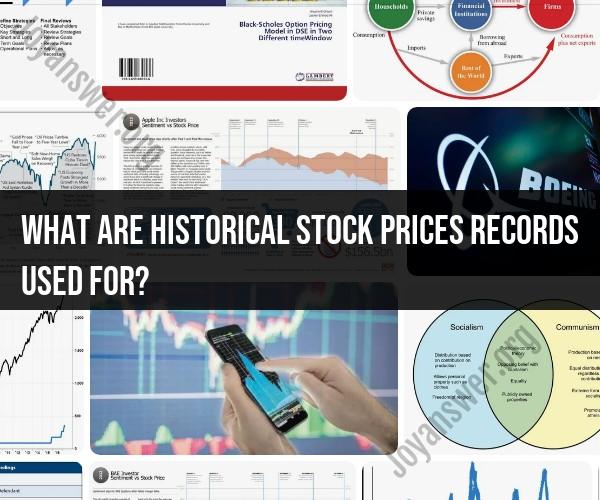
What are historical stock prices Records used for?
Historical stock price records are used for various purposes in the financial and investment sectors. Here are some key uses of historical stock prices:
Performance Analysis:
- Investors and analysts use historical stock prices to analyze the past performance of a stock or a portfolio. This analysis helps in assessing trends, volatility, and overall returns over different time periods.
Technical Analysis:
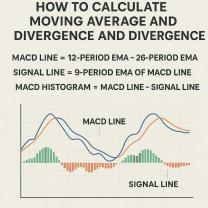
- Traders and technical analysts use historical price data to identify patterns, trends, and potential price movements. Technical analysis involves studying historical stock charts to make predictions about future price movements.
Risk Assessment:
- Historical stock prices are crucial for evaluating the risk associated with an investment. Investors assess factors such as price volatility, maximum drawdowns, and historical price fluctuations to understand the potential risks involved.
Portfolio Management:
- Portfolio managers use historical stock price records to optimize and rebalance investment portfolios. Understanding how different assets have performed over time helps in making informed decisions about asset allocation.
Backtesting Strategies:
- Investors and algorithmic traders often use historical stock prices to backtest trading strategies. This involves simulating how a particular investment strategy would have performed in the past based on historical data.
Valuation Models:
- Financial analysts use historical stock prices as inputs for various valuation models. Fundamental analysis, which involves evaluating a company's financial health, often relies on historical stock prices to calculate metrics such as price-to-earnings ratios and dividend yields.
Dividend Analysis:
- Investors interested in dividend-paying stocks analyze historical dividend payments. This helps in assessing the consistency and growth of dividends over time, providing insights into a company's dividend policy.
Economic Research:
- Economists and researchers use historical stock prices as indicators of broader economic trends. Stock market performance is often considered a reflection of overall economic health.
Educational Purposes:
- Historical stock prices are used in educational settings to teach finance, investment strategies, and market analysis. Students often analyze historical data to understand concepts such as risk and return.
Legal and Regulatory Compliance:
- Regulatory bodies and legal authorities may use historical stock prices when investigating financial misconduct or enforcing compliance with securities laws.
In summary, historical stock prices serve as a valuable resource for a wide range of financial activities, including analysis, decision-making, risk management, and research in both individual and institutional investment contexts.
What is the purpose of using historical stock price records?
Historical stock price records serve a multitude of purposes for investors, analysts, and even researchers. Here are some key uses:
1. Making Informed Investment Decisions:
- Analyzing Trends and Patterns: By looking at past price movements, investors can identify trends and patterns that may help them predict future performance. For example, if a stock tends to rise in price every December, an investor might consider buying it in November and selling it in January.
- Evaluating Risk and Volatility: Historical data can reveal how volatile a stock has been in the past, which helps investors assess the potential risk associated with investing in it. High volatility might deter some investors, while others might see it as an opportunity for high returns.
- Testing Investment Strategies: Investors can use historical data to back-test their investment strategies and see how they would have performed in the past. This can help them refine their strategies and make more informed decisions in the future.
2. Research and Analysis:
- Understanding Market Dynamics: Studying historical data can provide valuable insights into the factors that influence market movements, such as economic events, government policies, and global trends. This information can be used to assess the overall health of the market and make informed investment decisions.
- Developing Investment Models: Researchers and analysts can use historical data to develop and test investment models that predict future price movements. These models can be used to generate investment recommendations or inform financial decision-making.
- Academic Research: Historical stock market data is also used in academic research to study economic phenomena, develop financial theories, and test empirical models.
3. Additional benefits:
- Identifying Trading Opportunities: Technical analysts may use historical data to identify technical trading signals, such as support and resistance levels, that can be used to make short-term trading decisions.
- Portfolio Tracking and Performance Evaluation: Investors can use historical data to track the performance of their portfolios and compare them to benchmarks. This can help them assess their investment strategy and make adjustments as needed.
- Understanding Company Performance: By analyzing historical stock price data alongside company financials and news, investors can gain a deeper understanding of a company's performance and future prospects.
It's important to remember that past performance is not necessarily indicative of future results. However, analyzing historical stock price records can be a valuable tool for making informed investment decisions, conducting research, and gaining insights into the market.