What is the heating and cooling curve of water?
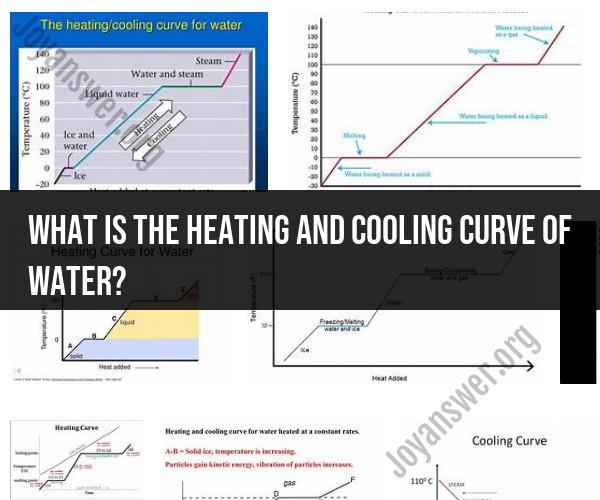
The heating and cooling curve of water is a graphical representation that illustrates how the temperature of water changes as it is heated or cooled at a constant rate while undergoing a phase change. It provides insights into the energy changes and phase transitions that occur as water transitions between its solid (ice), liquid (water), and gaseous (steam) states. Here's an explanation of the heating and cooling curve of water:
1. Heating Curve:
The heating curve shows how the temperature of a substance, in this case, water, changes as heat is added to it at a constant rate. As water starts in its solid state (ice), it first undergoes a temperature increase without changing its phase.
The heating curve begins at the left side with solid ice at a low temperature. As heat is applied, the temperature of the ice rises steadily. This portion of the curve represents the sensible heating phase, where the added energy increases the kinetic energy of water molecules, causing them to move faster and the temperature to rise.
The temperature continues to increase until it reaches the melting point of ice, which is 0 degrees Celsius (32 degrees Fahrenheit). At this point, additional heat energy is used to break the intermolecular bonds holding the water molecules in a fixed, crystalline structure. During this phase transition, the temperature remains constant despite the continued addition of heat. This flat portion of the curve is known as the latent heat of fusion region, where energy is absorbed as potential energy to change the phase from solid to liquid. Once all the ice has melted, the temperature begins to rise again.
After all the ice has become liquid water, the temperature continues to increase until it reaches the boiling point of water, which is 100 degrees Celsius (212 degrees Fahrenheit) at standard atmospheric pressure. At this point, additional heat energy is used to break the bonds between liquid water molecules to transition them into a gaseous state (steam). Similar to the melting point, the temperature remains constant during this phase change, which is represented by another flat portion of the curve called the latent heat of vaporization region.
Beyond the boiling point, the temperature of the steam continues to rise with additional heat input.
2. Cooling Curve:
The cooling curve, on the other hand, shows how the temperature of water changes as heat is removed from it at a constant rate. It represents the reverse process of the heating curve.
The cooling curve begins with hot steam at a high temperature. As heat is removed, the temperature of the steam decreases until it reaches the boiling point. At this point, heat energy is released as water vapor condenses into liquid water, keeping the temperature constant. This is the latent heat of vaporization region in reverse.
The temperature continues to decrease until it reaches the freezing point (0 degrees Celsius), where additional heat energy is released as liquid water freezes into solid ice. Again, the temperature remains constant during this phase change, and this is the latent heat of fusion region in reverse.
Beyond the freezing point, the temperature of the ice continues to decrease with further heat removal.
The heating and cooling curve of water is a valuable tool in thermodynamics and is used to understand phase changes, heat transfer, and energy transitions in various processes involving water, such as heating or cooling systems, refrigeration, and climate science. It provides a visual representation of the thermal behavior of water as it transitions between its three primary phases: solid, liquid, and gas.