What is Daily Treasury yield curve?
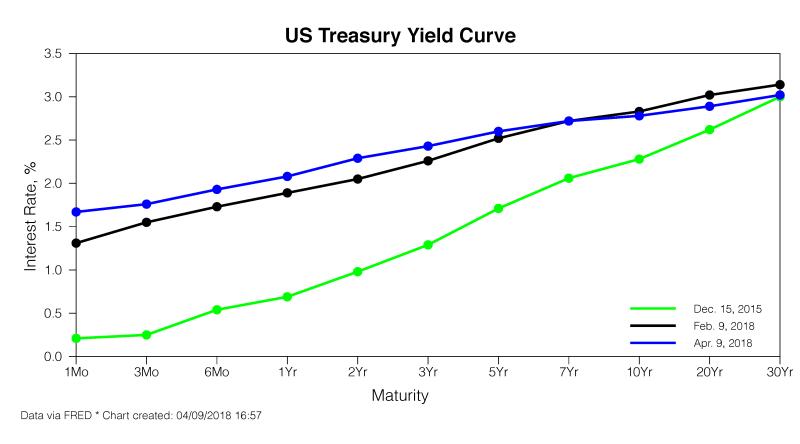
The Daily Treasury Yield Curve refers to the graphical representation of the yields (or interest rates) of U.S. Treasury securities across different maturities as of a specific day. It displays the relationship between the yields and the maturity dates of Treasury securities issued by the U.S. government.
Key aspects of the Daily Treasury Yield Curve:
Maturity Periods: It typically shows the yields for Treasury securities with various maturities ranging from short-term (e.g., 1-month, 3-month, 6-month) to medium-term (e.g., 2-year, 5-year) and long-term (e.g., 10-year, 30-year) durations.
Yield and Maturity Relationship: The curve plots the yields of Treasury securities against their respective maturities. Normally, it shows a rising curve where longer-term bonds have higher yields than shorter-term bonds. This normal upward slope reflects the higher risk associated with lending money for longer periods.
Market Indicator: The Daily Treasury Yield Curve is a crucial market indicator used by investors, economists, and policymakers to understand market expectations, interest rate trends, and the overall economic outlook. Changes in the shape of the yield curve can signal shifts in market sentiment, inflation expectations, and economic conditions.
Inverted Yield Curve: An inverted yield curve occurs when shorter-term yields are higher than longer-term yields. Historically, an inverted yield curve has often been associated with impending economic downturns or recessions. It may indicate concerns about future economic prospects.
Flat or Steep Yield Curve: A flat yield curve occurs when there is minimal difference between short-term and long-term yields, potentially indicating uncertainty in the market. A steep yield curve, on the other hand, indicates a substantial difference between short-term and long-term yields, often signaling positive economic expectations.
Federal Reserve Influence: The policies and actions of the Federal Reserve, such as interest rate adjustments and quantitative easing programs, can influence the shape and movement of the yield curve.
Monitoring the Daily Treasury Yield Curve provides insights into investor expectations, economic conditions, and potential shifts in interest rates. It serves as a valuable tool for analyzing financial markets and making informed decisions related to investments, borrowing costs, and economic policy.
The Daily Treasury yield curve is a graphical representation of the interest rates that the U.S. Treasury Department must pay to borrow money for different maturities. It is plotted with time on the x-axis and yield on the y-axis. Each point on the curve represents the yield for a specific maturity, such as two years, five years, or ten years.
Definition and Utilization of the Daily Treasury Yield Curve:
The Daily Treasury yield curve is a widely used tool for analyzing and understanding the current state of the U.S. economy. It is used by investors, policymakers, and economists to:
Assess interest rate expectations: The slope of the yield curve can provide insights into market expectations for future interest rates. A steeply upward-sloping curve suggests that investors believe interest rates will rise, while a downward-sloping curve suggests expectations of lower interest rates.
Gauge economic growth: The shape of the yield curve can also indicate the strength of the economy. A steeper curve often indicates economic growth, while a flatter or inverted curve may suggest economic slowdown or recession.
Evaluate investment opportunities: Investors use the yield curve to compare the yields of different Treasury securities and make informed investment decisions.
Information Provided by the Daily Treasury Yield Curve:
The Daily Treasury yield curve provides several key pieces of information about the U.S. economy:
Relative cost of borrowing: The yield curve shows the relative cost of borrowing for different maturities. For instance, if the yield curve is upward-sloping, borrowing for longer maturities is more expensive than borrowing for shorter maturities.
Investors' risk perception: The curve's shape reflects investors' perceptions of risk associated with different maturities. A steeper curve suggests investors perceive greater risk for longer maturities, requiring higher yields.
Market expectations for inflation: The yield curve can also provide insights into market expectations for inflation. If investors anticipate higher inflation, they may demand higher yields for longer maturities to compensate for the erosion of purchasing power.
The Daily Treasury yield curve is a dynamic and constantly evolving representation of market sentiment and economic conditions. It is a valuable tool for understanding the financial markets and making informed economic decisions.