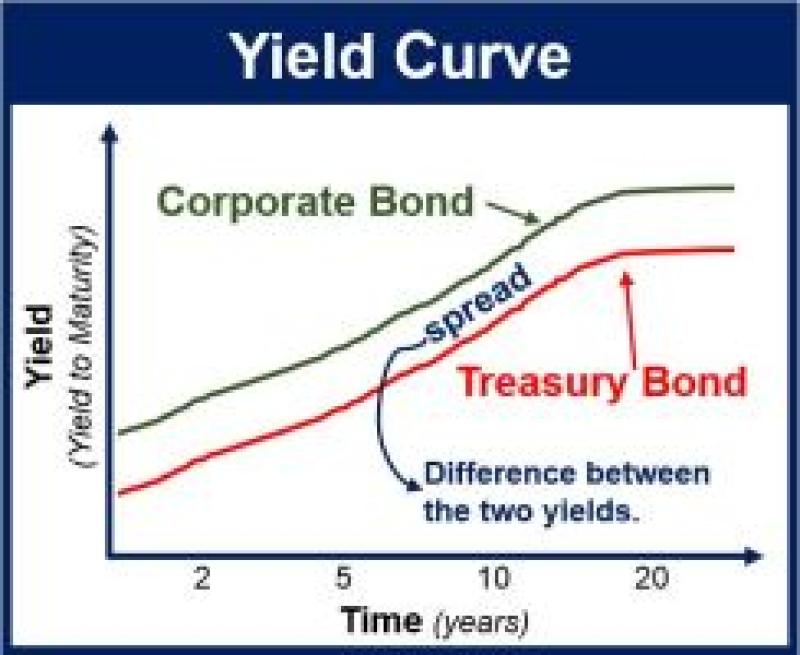
What is a Corporate yield curve?
The corporate yield curve is a graphical representation that shows the relationship between the yields (interest rates) and the maturity dates of a range of corporate bonds with varying maturity periods. It's similar to the government yield curve but specifically focuses on corporate bonds.
Here are some key points about the corporate yield curve:
Yield and Maturity Relationship: Like other yield curves, the corporate yield curve plots the yields of corporate bonds against their respective maturities. Typically, the horizontal axis represents the time to maturity of the bonds, while the vertical axis represents the yields.
Variation in Yields: The curve illustrates how the yields of corporate bonds change concerning their time to maturity. It might slope upwards (normal yield curve), be flat, or even slope downwards (inverted yield curve), depending on various market conditions and investor expectations.
Risk and Return Relationship: The shape of the corporate yield curve reflects the relationship between risk and return. Longer-term bonds usually have higher yields to compensate investors for the added risk associated with the longer time frame.
Market Sentiment Indicator: Similar to government yield curves, the corporate yield curve serves as an indicator of economic conditions and market sentiment. Changes in the shape of the curve can signal shifts in investor confidence, economic growth expectations, or concerns about future conditions.
Impact of Economic Factors: Factors such as inflation expectations, central bank policies, market demand for corporate debt, and general economic conditions influence the shape and movement of the corporate yield curve.
Understanding the corporate yield curve is crucial for investors, analysts, and policymakers as it provides insights into the pricing of corporate debt, expectations for future interest rates, and broader economic trends, aiding in decision-making within financial markets.
A corporate yield curve is a graphical representation of the interest rates that a company must pay to borrow money for different maturities. The curve is plotted with time on the x-axis and yield on the y-axis. Each point on the curve represents the yield for a specific maturity, such as two years, five years, or ten years.
Corporate yield curves are used to:
- compare the relative costs of borrowing for different maturities: A company can use the yield curve to determine whether it is more cost-effective to borrow for a shorter or longer period of time.
- assess the company's overall financial health: The shape of the yield curve can provide insights into the company's creditworthiness. For example, a steeply upward-sloping yield curve may indicate that investors believe the company is riskier than a company with a flatter yield curve.
- make investment decisions: Investors use corporate yield curves to compare the yields of different corporate bonds.
Factors that affect the corporate yield curve:
- The company's creditworthiness: Companies with higher credit ratings typically pay lower interest rates than companies with lower credit ratings.
- The overall level of interest rates: When interest rates are rising, the corporate yield curve will generally shift upwards.
- The company's industry: Companies in certain industries, such as utilities and telecommunications, may have flatter yield curves than companies in other industries, such as technology and manufacturing.
Interpretation of the corporate yield curve:
An upward-sloping yield curve: This indicates that investors demand higher yields for longer-term maturities, suggesting that they perceive greater risk associated with longer-term borrowing.
A downward-sloping yield curve: This suggests that investors are willing to accept lower yields for longer-term maturities, implying confidence in the company's future cash flows.
A flat yield curve: This indicates that investors perceive similar levels of risk for different maturities, implying neutral expectations about future interest rates and economic conditions.