How to calculate instantaneous rate of change from graph?
To calculate the instantaneous rate of change from a graph, you need to find the slope of the tangent line at a specific point on the graph. The slope of the tangent line represents the rate at which the dependent variable is changing with respect to the independent variable at that particular point.
Here are the general steps to calculate the instantaneous rate of change:
Select a Point:Choose a specific point on the graph where you want to find the instantaneous rate of change. This point will serve as the starting point for the tangent line.
Find the Tangent Line:Determine the slope of the tangent line at the chosen point. This can be done visually or by using calculus if you have an explicit function for the graph.
Visual Method:
- Draw a tangent line that just touches the curve at the chosen point.
- Estimate the slope of this tangent line. You can do this by visual inspection or by drawing a right-angled triangle and measuring the rise over run.
Calculus Method:
- If you have an explicit function for the graph, find the derivative .
- Evaluate the derivative at the chosen point to find the slope of the tangent line.
Interpretation:The slope of the tangent line represents the instantaneous rate of change at the chosen point. If the graph represents a physical quantity (e.g., position, velocity, temperature), the slope gives the rate at which that quantity is changing at that specific moment.
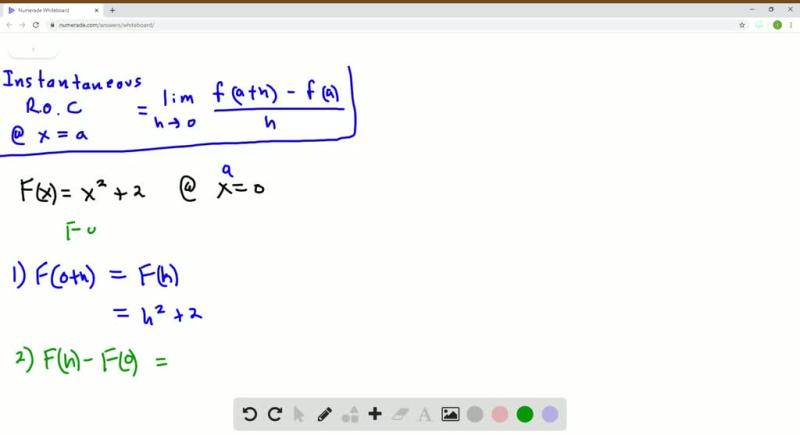
The mathematical formula for the instantaneous rate of change (when you have an explicit function) is given by the derivative of the function at the specified point:
where is the x-coordinate of the chosen point.
Keep in mind that the accuracy of your calculation depends on the precision of your method, whether visual or mathematical. Calculus provides a more precise method for finding instantaneous rates of change, especially when dealing with functions with known derivatives.
How is the instantaneous rate of change determined from a graph?
The instantaneous rate of change of a function at a point is the slope of the tangent line to the graph of the function at that point. The slope of a line is a measure of how steep the line is, and it is calculated as the change in y divided by the change in x between any two points on the line.
To determine the instantaneous rate of change of a function from a graph, follow these steps:
- Identify the point on the graph where you want to determine the instantaneous rate of change.
- Draw the tangent line to the graph at that point.
- Calculate the slope of the tangent line.
The slope of the tangent line will be the instantaneous rate of change of the function at that point.
What graphical characteristics indicate the instantaneous rate of change?
The instantaneous rate of change of a function is indicated by the steepness of the graph at a particular point. The steeper the graph, the greater the instantaneous rate of change. Conversely, the flatter the graph, the smaller the instantaneous rate of change.
Here are some specific graphical characteristics that indicate the instantaneous rate of change:
- A point where the graph is horizontal has an instantaneous rate of change of 0.
- A point where the graph is increasing has a positive instantaneous rate of change.
- A point where the graph is decreasing has a negative instantaneous rate of change.
Are there specific formulas used to calculate instantaneous rates of change from graphs?
While it is possible to estimate the instantaneous rate of change from a graph by drawing tangent lines and calculating their slopes, there are also specific formulas that can be used to calculate the instantaneous rate of change for a given function. These formulas are based on the concept of derivatives.
The derivative of a function is a measure of how much the function is changing at a particular point. The derivative of a function can be calculated using a variety of techniques, including differentiation rules, differentiation tables, and limits.
Can the slope of a tangent line represent instantaneous rate of change on a graph?
Yes, the slope of a tangent line can represent the instantaneous rate of change on a graph. The slope of a tangent line is equal to the instantaneous rate of change of the function at the point where the tangent line intersects the graph.
Are there online tools or software for computing instantaneous rates of change from graphs?
Yes, there are a number of online tools and software programs that can be used to compute instantaneous rates of change from graphs. These tools typically allow you to input a function or a graph of a function, and then they will calculate the instantaneous rate of change at a specified point.
Some popular online tools for computing instantaneous rates of change from graphs include:
- Desmos
- GeoGebra
- Mathway
- WolframAlpha