How to calculate z score example?
A z-score, also known as a standard score, measures how many standard deviations a data point is from the mean (average) of a dataset. It helps to standardize data and compare individual data points to the overall distribution. Here's how to calculate a z-score with an example:
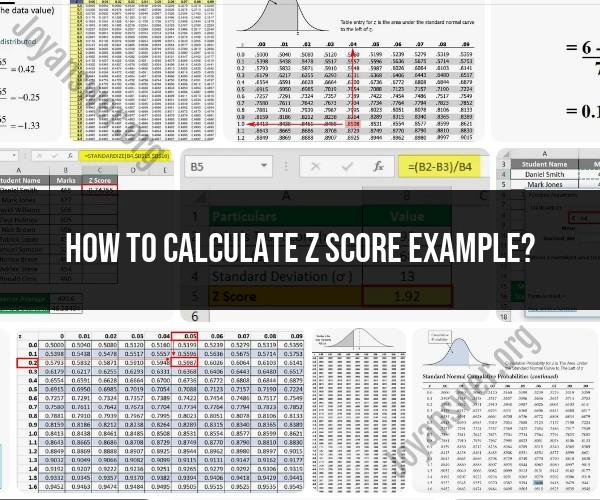
Formula for Calculating the Z-Score:
The z-score formula is:
Where:
- is the z-score.
- is the individual data point you want to calculate the z-score for.
- is the mean (average) of the dataset.
- is the standard deviation of the dataset.
Example: Calculating a Z-Score
Suppose you have a dataset of test scores for a class of 100 students, and you want to calculate the z-score for a student who scored 85 on the test. The mean test score for the class is 75, and the standard deviation is 10.
Using the formula:
Plug in the values:
- (the student's score) is 85.
- (the mean) is 75.
- (the standard deviation) is 10.
Now, calculate the z-score:
The z-score for a test score of 85 in this dataset is 1. This means that the score of 85 is 1 standard deviation above the mean (which is 75). A z-score of 1 indicates that the score is higher than the average score in the dataset.
A positive z-score indicates a value above the mean, while a negative z-score would indicate a value below the mean. Z-scores are useful for comparing data points to a standard reference point and for assessing how far a data point deviates from the mean in terms of standard deviations.
Understanding Z-Scores: Calculation and Example
A z-score is a statistical measurement of how many standard deviations a specific point is away from the mean of a distribution. It is calculated by subtracting the mean from the point of interest and then dividing by the standard deviation.
Formula:
z-score = (x - μ) / σ
where:
- x is the point of interest
- μ is the mean of the distribution
- σ is the standard deviation of the distribution
Example:
Suppose you have a dataset of student test scores with a mean of 70 and a standard deviation of 10. You want to calculate the z-score of a student who scored 80 on the test.
z-score = (80 - 70) / 10 = 1.0
This means that the student's score was 1 standard deviation above the mean.
The Significance of Z-Scores in Statistics
Z-scores are significant in statistics because they allow us to compare data points from different distributions. For example, we can use z-scores to compare the test scores of students from different grades, or the heights of people from different countries.
Z-scores can also be used to calculate the probability of a particular event occurring. For example, we can use z-scores to calculate the probability of a student scoring above a certain grade on a test, or the probability of a person being taller than a certain height.
How to Calculate Z-Scores for Data Analysis
To calculate z-scores for data analysis, you will need to know the mean and standard deviation of the distribution. Once you have this information, you can use the formula above to calculate the z-score for each point of interest.
You can also use statistical software to calculate z-scores for you. Most statistical software packages have a built-in function for calculating z-scores.
Interpreting Z-Scores in Practical Scenarios
To interpret z-scores in practical scenarios, you can use the following guidelines:
- A z-score of 0 means that the point is exactly equal to the mean.
- A z-score of 1 means that the point is 1 standard deviation above the mean.
- A z-score of -1 means that the point is 1 standard deviation below the mean.
- A z-score of 2 means that the point is 2 standard deviations above the mean.
- A z-score of -2 means that the point is 2 standard deviations below the mean.
In general, a z-score of greater than 3 or less than -3 is considered to be statistically significant. This means that the point is very likely to be an outlier, or a point that is different from the rest of the data.
Real-Life Application of Z-Scores in Statistics
Z-scores are used in a wide variety of real-life applications. Here are a few examples:
- Education: Z-scores can be used to compare the performance of students on standardized tests. For example, a school district might use z-scores to compare the performance of students from different schools or different grades.
- Business: Z-scores can be used to identify trends in sales data, customer satisfaction data, and other business metrics. For example, a company might use z-scores to identify products that are selling well or poorly, or to identify customers who are likely to churn.
- Medicine: Z-scores can be used to identify patients who are at risk of certain diseases or conditions. For example, a doctor might use z-scores to identify patients who are at risk of developing heart disease or diabetes.
Z-scores are a powerful tool that can be used to analyze and interpret data in a variety of ways. By understanding how to calculate and interpret z-scores, you can gain valuable insights into your data.