How to research a stock using Yahoo Finance?
Researching a stock using Yahoo Finance can provide a wealth of information and insights. Here's a step-by-step guide to conducting stock research on Yahoo Finance:
Access Yahoo Finance:
- Go to the Yahoo Finance website or app (available for both web and mobile devices).
Search for the Stock:
- Use the search bar at the top of the page to enter the ticker symbol or the name of the company whose stock you want to research.
Explore the Overview:
- Once you've found the stock, you'll land on the stock's overview page. Here, you'll find key information such as the current stock price, market cap, trading volume, and more.
Check Stock Statistics:
- Look for sections like "Statistics," which provide additional details on the stock's performance metrics. This section may include data on price-earnings ratio (P/E), earnings per share (EPS), dividend yield, and other key financial indicators.
Review Company Profile:
- Navigate to the "Profile" section to learn about the company's business overview, industry, key executives, headquarters location, and a brief description of its operations.
Analyze Financials:
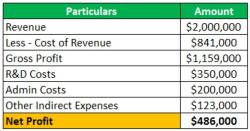
- Explore the "Financials" section for detailed information on the company's income statement, balance sheet, and cash flow statement. This data offers insights into the company's financial health, revenue, expenses, and profitability.
Examine Analyst Recommendations:
- Check the "Analyst Recommendations" section to see what Wall Street analysts are saying about the stock. It often includes ratings, price targets, and consensus opinions.
Track News and Recent Developments:
- Scroll through the "News" section to stay updated on recent articles, press releases, and news related to the company. This information can provide insights into recent developments that might impact the stock price.
Utilize Charts and Historical Data:
- Explore the "Charts" section to visualize the stock's historical performance. Adjust the timeframes (daily, weekly, monthly) to analyze price movements, trends, and patterns.
Use Additional Features:
- Yahoo Finance offers additional tools and features, such as portfolio tracking, comparison with competitors, option chains, and customizable watchlists. Explore these features based on your research needs.
- Read Community Discussions:
- Yahoo Finance often hosts community forums where users discuss stocks. While not always entirely reliable, it can provide insights and different perspectives on the stock.
Remember that while Yahoo Finance offers a comprehensive set of tools for stock research, it's essential to combine this information with other sources and perform thorough due diligence before making any investment decisions.
Yahoo Finance is a comprehensive financial website that provides a wide range of tools and resources for stock research and analysis. It is a popular platform among individual investors, financial professionals, and students due to its user-friendly interface, extensive data coverage, and valuable analytical tools.
How can Yahoo Finance be used for stock research and analysis?
Yahoo Finance offers various features and functionalities that can be effectively utilized for stock research and analysis. Here are some key ways to use Yahoo Finance for this purpose:
Quote and Charting: Access real-time and historical stock quotes, charts, and technical indicators to track a stock's price movements and identify potential trading opportunities.
Company Profile and Financials: Gain insights into a company's business overview, financial statements, key metrics, and analyst ratings to evaluate its financial health and growth prospects.
News and Research: Stay informed about company-specific news, industry trends, and analyst reports to make informed investment decisions.
Stock Screener: Utilize the stock screener to filter stocks based on various criteria, such as market capitalization, sector, valuation ratios, and technical indicators.
Portfolio Management: Track your investment portfolio's performance, monitor dividends, and compare your holdings to market benchmarks.
What tools and resources does Yahoo Finance offer for stock analysis?
Yahoo Finance provides a suite of tools and resources that can be employed for comprehensive stock analysis. These include:
Key Financial Ratios: Access key financial metrics such as P/E ratio, price-to-sales ratio, debt-to-equity ratio, and operating margins to assess a company's profitability, valuation, and financial stability.
Interactive Charts and Indicators: Utilize interactive charts and technical indicators, such as moving averages, Bollinger Bands, and Relative Strength Index (RSI), to identify trends, potential support and resistance levels, and momentum shifts.
Analyst Recommendations and Ratings: Review analyst recommendations, ratings, and price targets to gain insights into professional opinions on a company's future prospects.
Comparative Performance Analysis: Compare a company's performance against industry peers and market benchmarks to evaluate its relative standing.
News and Research Feed: Stay updated on company-specific news, industry trends, and analyst reports to make informed investment decisions.
What are the key metrics to consider when researching stocks on Yahoo Finance?
When researching stocks on Yahoo Finance, it is crucial to consider a combination of fundamental and technical metrics to assess a company's financial health, growth potential, and trading opportunities. Key fundamental metrics include:
Earnings per Share (EPS): EPS represents the company's profit per share of common stock, indicating its profitability.
Price-to-Earnings Ratio (P/E Ratio): The P/E ratio compares a company's stock price to its earnings per share, providing a relative valuation measure.
Debt-to-Equity Ratio: This ratio measures the company's reliance on debt compared to shareholder equity, indicating its financial stability.
Operating Margin: Operating margin measures the company's profitability from its core operations, excluding interest and tax expenses.
Technical metrics, on the other hand, focus on analyzing the stock's price movements and trends. Key technical indicators include:
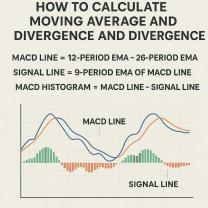
Moving Averages: Moving averages smooth out price fluctuations and help identify trends and support/resistance levels.
Bollinger Bands: Bollinger Bands provide a volatility measure, indicating potential overbought or oversold conditions.
Relative Strength Index (RSI): RSI measures the speed and magnitude of price movements, helping identify overbought or oversold conditions.
By analyzing both fundamental and technical metrics, investors can gain a comprehensive understanding of a company's financial performance, growth prospects, and trading opportunities.