What are the different types of accounting ratios?
Accounting ratios are key financial metrics used to analyze various aspects of a company's performance, financial health, and efficiency. These ratios can be broadly categorized into several types based on the aspects of a business they measure. Here are some common types of accounting ratios:
Liquidity Ratios: These ratios assess a company's ability to meet its short-term obligations. Examples include:
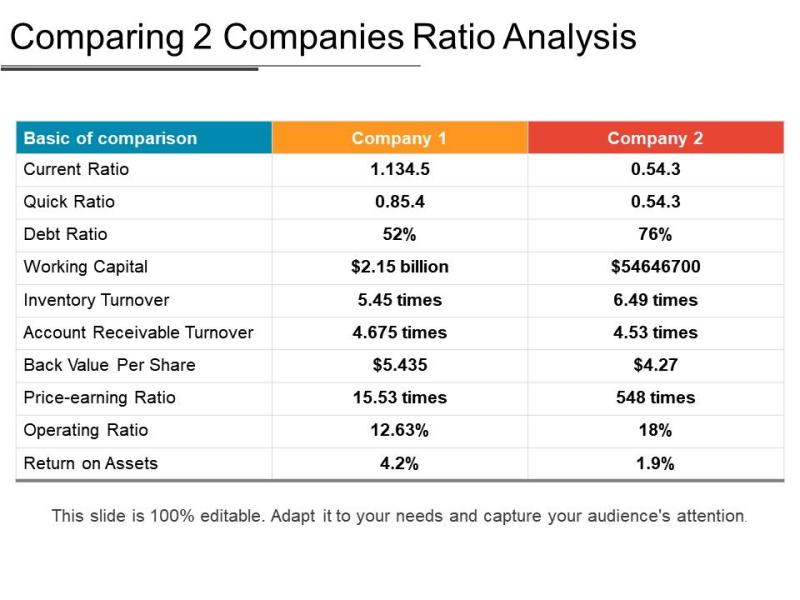
- Current Ratio: Current assets divided by current liabilities.
- Quick Ratio (Acid-Test Ratio): (Current assets - Inventory) divided by current liabilities.
Profitability Ratios: Profitability ratios measure a company's ability to generate profits relative to its revenue, assets, equity, or other metrics. Examples include:
- Gross Profit Margin: (Gross profit / Revenue) * 100.
- Net Profit Margin: (Net income / Revenue) * 100.
- Return on Assets (ROA): (Net income / Total assets) * 100.
- Return on Equity (ROE): (Net income / Shareholders' equity) * 100.
Efficiency Ratios: Efficiency ratios evaluate how effectively a company utilizes its assets to generate sales or revenue. Examples include:
- Asset Turnover Ratio: Revenue divided by average total assets.
- Inventory Turnover Ratio: Cost of goods sold divided by average inventory.
- Receivables Turnover Ratio: Revenue divided by average accounts receivable.
Solvency Ratios: Solvency ratios assess a company's long-term financial stability and its ability to meet long-term obligations. Examples include:
- Debt-to-Equity Ratio: Total debt divided by shareholders' equity.
- Interest Coverage Ratio: Earnings before interest and taxes (EBIT) divided by interest expense.
Coverage Ratios: Coverage ratios measure a company's ability to cover its financial obligations, such as interest payments or dividends. Examples include:
- Times Interest Earned (Interest Coverage) Ratio: Earnings before interest and taxes (EBIT) divided by interest expense.
- Dividend Coverage Ratio: Net income divided by dividends paid.
Market Ratios: Market ratios provide insight into how investors perceive a company's performance and valuation in the market. Examples include:
- Price-to-Earnings (P/E) Ratio: Market price per share divided by earnings per share.
- Price-to-Book (P/B) Ratio: Market price per share divided by book value per share.
- Dividend Yield: Dividend per share divided by market price per share.
These are just some examples of the various types of accounting ratios used by analysts, investors, and managers to evaluate different aspects of a company's financial performance and position. Each ratio provides unique insights into different facets of a company's operations and financial health.
Accounting Ratios: Unveiling a Company's Financial Health
Accounting ratios are powerful tools used to analyze a company's financial performance and health. By comparing different financial statement items, they provide valuable insights beyond what individual numbers can reveal.
1. Types of Accounting Ratios and their Significance:
- Liquidity Ratios: Measure a company's ability to meet short-term obligations (e.g., Current Ratio, Quick Ratio).
- Significance: Indicate how easily a company can convert assets to cash to pay bills.
- Solvency Ratios: Assess a company's long-term ability to meet debt obligations (e.g., Debt-to-Equity Ratio, Debt Ratio).
- Significance: Reveal a company's financial leverage and risk of default.
- Profitability Ratios: Evaluate a company's efficiency in generating profit (e.g., Profit Margin, Return on Equity (ROE)).
- Significance: Indicate how well a company converts revenue into profit and generates returns for shareholders.
- Efficiency Ratios: Analyze how effectively a company utilizes its resources (e.g., Inventory Turnover Ratio, Receivables Turnover Ratio).
- Significance: Measure how quickly a company turns over inventory and collects payments, impacting cash flow.
- Market Value Ratios: Compare a company's market value to its financial performance (e.g., Price-to-Earnings (P/E) Ratio, Price-to-Book (P/B) Ratio).
- Significance: Indicate investor sentiment and potential over/undervaluation.
2. Insights into Financial Health:
By analyzing various ratios across different periods and comparing them to industry benchmarks or competitors, you can gain insights into:
- Short-term liquidity: Can the company pay its bills on time?
- Long-term solvency: Is the company at risk of financial distress?
- Profitability: How effectively is the company generating profits?
- Operational efficiency: Is the company efficiently utilizing its resources?
- Investment potential: Is the company undervalued or overpriced compared to its peers?
3. Industry-Specific Accounting Ratios:
Yes, specific ratios are often used within different industries to reflect their unique characteristics and financial drivers. For example:
- Retail: Inventory Turnover Ratio is crucial due to high inventory levels.
- Manufacturing: Return on Assets (ROA) gauges efficiency in using production assets.
- Financial Services: Capital Adequacy Ratio measures risk management in banks.
It's important to remember that no single ratio provides a complete picture. Analyzing a combination of relevant ratios alongside financial statements and industry context offers a more comprehensive understanding of a company's financial health.


