How to use tree diagrams in probability?
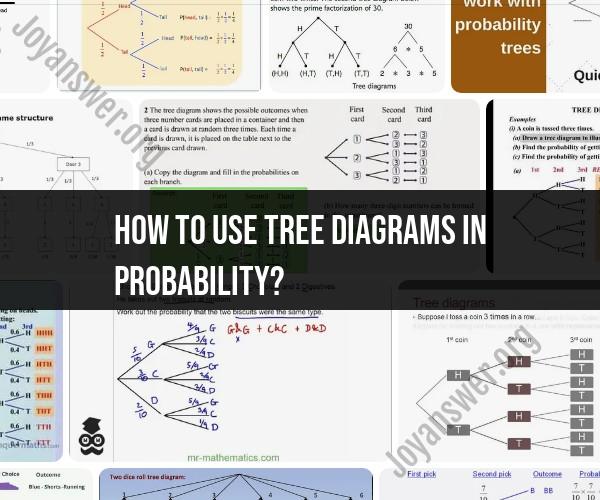
Tree diagrams are a visual tool used in probability to represent and calculate the outcomes of probabilistic events, particularly in situations involving multiple stages or choices. Here's how to use tree diagrams in probability:
Identify the Probabilistic Events:
- Start by identifying the series of events or choices that lead to the final outcome you want to calculate the probability for. These events could be sequential or involve making choices.
Create the First Branch:
- Draw the first branch or line of the tree diagram to represent the initial event or choice. Label this branch with the possible outcomes of this event.
Extend the Branches:
- For each outcome on the first branch, create new branches extending from it to represent the next stage of events or choices. Label these branches with the possible outcomes of the second event.
Continue Extending Branches:
- Continue this process for all subsequent stages of events or choices until you have represented all the events or choices in your probabilistic scenario.
Assign Probabilities:
- For each outcome on the tree diagram, assign the respective probability of that outcome occurring. The sum of the probabilities for all outcomes at a particular stage should equal 1 (100%).
Calculate Probabilities:
- To calculate the probability of a specific sequence of events occurring, multiply the probabilities along the path that leads to that sequence. For example, if you want to find the probability of Event A and then Event B happening, multiply the probability of Event A by the probability of Event B given that Event A has occurred.
Calculate Total Probabilities:
- If you want to calculate the probability of a particular outcome, considering all possible paths that lead to that outcome, sum the probabilities of each path that results in the desired outcome.
Simplify and Interpret:
- Simplify the tree diagram as needed, and interpret the results. The tree diagram allows you to visualize the different possible outcomes and their associated probabilities.
Here's a simple example to illustrate how to use a tree diagram in probability:
Scenario: You're flipping a coin and then rolling a six-sided die.
Create the First Branch: Draw a branch representing the coin flip. There are two outcomes: Heads (H) and Tails (T).
Extend the Branches: From each coin flip outcome, create branches for rolling the die. Each die outcome is labeled from 1 to 6.
Assign Probabilities: Since a fair coin and die are used, each outcome at each stage has a probability of 1/2 for the coin and 1/6 for the die.
Calculate Probabilities: To find the probability of getting Heads (H) and rolling a 3 on the die, multiply the probability of H (1/2) by the probability of rolling a 3 (1/6). The result is (1/2) * (1/6) = 1/12.
Calculate Total Probabilities: To find the probability of rolling an odd number on the die, consider all the paths that lead to this outcome: (H, 1), (H, 3), (H, 5), (T, 1), (T, 3), (T, 5). Sum the probabilities of these paths: (1/2) * (1/6) + (1/2) * (1/6) + (1/2) * (1/6) + (1/2) * (1/6) + (1/2) * (1/6) + (1/2) * (1/6) = 3/4.
This tree diagram helps you visualize and calculate the probabilities of various outcomes in a two-stage probabilistic scenario. You can use more complex tree diagrams to analyze more intricate probabilistic events with multiple stages or choices.
Using Tree Diagrams in Probability: A Visual Guide
A tree diagram is a visual tool that can be used to represent the probabilities of different events happening in sequence. It is useful for solving probability problems that involve multiple events.
To construct a tree diagram, start by drawing a circle for the first event. Then, for each possible outcome of the first event, draw a branch. The probability of each outcome should be written on the branch.
Next, for each outcome of the first event, draw branches for the possible outcomes of the second event. Again, write the probability of each outcome on the branch.
Continue this process for all of the events in the sequence. The final branches of the tree will represent the possible outcomes of the entire sequence of events.
Probability and Decision-Making with Tree Diagrams
Tree diagrams can be used to calculate the probability of any event in the sequence. To do this, simply multiply the probabilities along the branches that lead to that event.
For example, if you have a tree diagram with three events in sequence, and the probabilities of the outcomes of each event are 0.5, 0.4, and 0.3, then the probability of the event that occurs if all three outcomes with the highest probability happen is 0.5 * 0.4 * 0.3 = 0.06.
Tree diagrams can also be used to make decisions. For example, if you are faced with a situation where you have to make a choice, you can use a tree diagram to calculate the probability of each possible outcome of your choice. This can help you to make a more informed decision.
Constructing and Interpreting Tree Diagrams for Complex Events
Tree diagrams can be used to represent complex events, but it is important to be careful when constructing and interpreting them.
One important thing to keep in mind is that the probabilities on the branches of the tree must add up to 1. This is because the branches represent all of the possible outcomes of the event.
Another important thing to keep in mind is that tree diagrams can only be used to represent events that are independent. Independent events are events that do not affect each other.
For example, if you are flipping a coin twice, the two events are independent. This is because the outcome of the first flip does not affect the outcome of the second flip.
However, if you are drawing two balls from a bag without replacement, the two events are not independent. This is because the outcome of the first draw affects the outcome of the second draw.
Solving Probability Problems with Tree Diagrams
Tree diagrams can be used to solve a variety of probability problems. For example, you can use a tree diagram to calculate the probability of:
- Getting a certain combination of heads and tails when flipping a coin multiple times
- Drawing a certain combination of cards from a deck
- Rolling a certain combination of numbers on dice
- Getting a certain result on a test
To solve a probability problem with a tree diagram, simply follow these steps:
- Construct a tree diagram that represents the problem.
- Calculate the probability of each event in the sequence.
- Multiply the probabilities along the branches that lead to the event that you are interested in.
Real-Life Applications and Insights into Probability Trees
Tree diagrams can be used in a variety of real-life applications. For example, tree diagrams can be used to:
- Calculate the probability of a successful business venture
- Calculate the probability of a customer returning to a store
- Calculate the probability of a patient developing a certain disease
- Calculate the probability of a machine producing a defective product
Tree diagrams can also be used to gain insights into the relationships between different events. For example, if you have a tree diagram that represents the probability of a customer returning to a store, you can use the tree diagram to identify the factors that are most likely to influence the customer's decision to return.
Overall, tree diagrams are a powerful tool that can be used to solve probability problems and gain insights into the relationships between different events.
