How is a tree diagram like a tree?
A tree diagram in the context of data visualization and probability theory is called so because its structure resembles that of an upside-down tree, with a single root at the top and branches that diverge downward. This resemblance is primarily in terms of the visual representation and the branching structure. Here's how a tree diagram is like a tree:
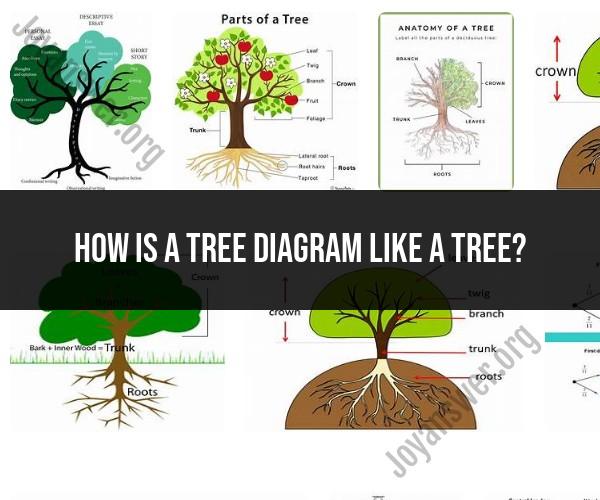
Single Root: A tree diagram, like a tree in nature, starts with a single root node at the top. In a tree diagram, this root represents the initial or starting point of a decision or process.
Branching Structure: From the root node, branches extend downward to represent different choices, possibilities, or outcomes. Each branch represents a decision point or an event that leads to further branches.
Nodes and Leaves: Just as a tree has nodes (points where branches intersect or split) and leaves (the endpoints of branches), a tree diagram has nodes that represent decision points or events and leaves that represent the final outcomes or results of those decisions.
Hierarchy: Both trees and tree diagrams follow a hierarchical structure. In a tree diagram, branches can further split into sub-branches, creating a hierarchy of decisions or events.
Visual Resemblance: When you look at a tree diagram, it often visually resembles the structure of an actual tree, with its root, branches, and leaves. This visual representation helps convey complex decision-making or probability scenarios in a clear and organized manner.
Ease of Understanding: The tree-like structure of a tree diagram makes it easy for individuals to follow a sequence of events, choices, or possibilities, much like how you can follow the branching paths of a tree in nature.
Used for Representation: Just as trees in nature represent the growth and development of life, tree diagrams are used to represent the development of decisions, outcomes, or processes in various fields, including probability, decision analysis, and computer science.
It's important to note that while tree diagrams are often used for visualizing decision trees and probability scenarios, they are a simplified representation used for modeling and analysis. In contrast, real trees in nature are complex living organisms with biological functions. The term "tree diagram" is primarily a metaphorical comparison to the branching structure found in nature to help people understand and communicate complex concepts and decision processes more effectively.