What are the tools of financial statement analysis?
Financial statement analysis involves examining a company's financial statements to assess its financial performance and health. Various tools and techniques are used in this process to gain insights into a company's operations, profitability, liquidity, and solvency. Here are some of the key tools of financial statement analysis:
Ratio Analysis:
- Liquidity Ratios: These ratios assess a company's ability to meet its short-term financial obligations. Examples include the current ratio and the quick ratio.
- Profitability Ratios: These ratios evaluate a company's profitability. Examples include the net profit margin, return on assets (ROA), and return on equity (ROE).
- Solvency Ratios: These ratios measure a company's long-term financial stability and ability to meet its long-term obligations. Examples include the debt-to-equity ratio and interest coverage ratio.
- Efficiency Ratios: These ratios assess how efficiently a company is using its assets and resources. Examples include asset turnover and inventory turnover ratios.
Common-Size Financial Statements:
- Common-size financial statements express each line item as a percentage of total revenue (for income statements) or total assets (for balance sheets). This helps in comparing financial statements of companies of different sizes.
Trend Analysis:
- Trend analysis involves comparing financial data over multiple periods (e.g., years or quarters) to identify trends, patterns, and changes in a company's financial performance.
Vertical Analysis:
- Vertical analysis involves expressing each line item on the financial statements as a percentage of a key financial statement component. For example, on the income statement, expenses are expressed as a percentage of total revenue.
Horizontal Analysis:
- Horizontal analysis, also known as horizontal or trend analysis, involves comparing financial data over multiple periods to identify changes in specific line items, such as revenue, expenses, and net income.
DuPont Analysis:
- DuPont analysis breaks down the return on equity (ROE) into its components, including the net profit margin, asset turnover, and financial leverage. This provides insights into what is driving changes in ROE.
Cash Flow Analysis:
- Cash flow analysis involves examining a company's cash flow statements to assess its ability to generate cash from its operating, investing, and financing activities. Key metrics include operating cash flow and free cash flow.
Credit Rating Analysis:
- Credit rating agencies assess a company's creditworthiness based on its financial statements and other relevant information. These ratings provide insights into a company's ability to meet its debt obligations.
Peer Analysis:
- Comparing a company's financial performance to that of its industry peers can provide valuable insights into its relative strengths and weaknesses.
Qualitative Analysis:
- In addition to quantitative analysis, qualitative factors such as industry trends, management quality, competitive positioning, and economic conditions are considered to provide a more comprehensive view of a company's financial health.
Financial statement analysis is a multifaceted process that often involves using a combination of these tools and techniques to assess a company's financial position, profitability, and overall performance. It helps investors, creditors, analysts, and management make informed decisions and identify areas for improvement or strategic changes.
Tools of Financial Statement Analysis: Exploring the Essentials
Financial statement analysis is the process of evaluating a company's financial performance and position by analyzing its financial statements. The three main types of financial statements are the balance sheet, income statement, and cash flow statement.
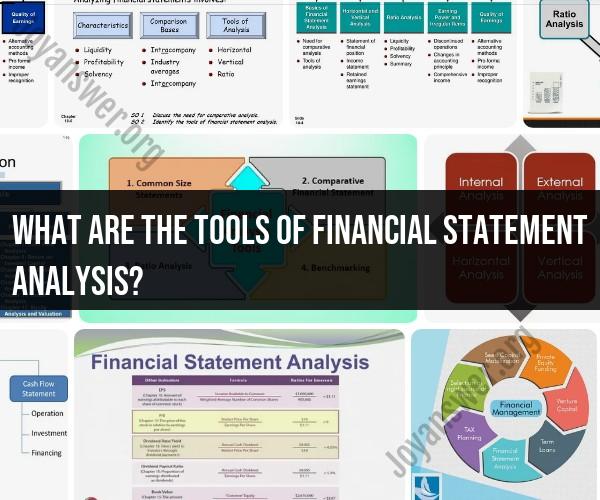
There are a number of tools that financial analysts use to analyze financial statements. Some of the most common tools include:
- Horizontal analysis: Horizontal analysis compares financial data across multiple periods of time to identify trends.
- Vertical analysis: Vertical analysis compares different line items on a financial statement to see how they relate to each other.
- Ratio analysis: Ratio analysis compares two or more financial statement line items to produce a ratio. Ratios can be used to assess profitability, liquidity, efficiency, and financial leverage.
- Benchmarking: Benchmarking compares a company's financial performance to that of its peers or industry.
Analyzing Financial Statements: Key Tools and Methods
In addition to the tools listed above, there are a number of other tools and methods that financial analysts use to analyze financial statements. Some of the most common include:
- Trend analysis: Trend analysis identifies trends in financial data over time. This can help analysts to identify potential problems or opportunities.
- Common size analysis: Common size analysis expresses all financial statement line items as a percentage of a common base, such as total assets or total revenue. This makes it easier to compare financial statements between companies of different sizes.
- Funds flow analysis: Funds flow analysis analyzes the movement of cash into and out of a company. This can help analysts to identify how a company is financing its operations and investing activities.
Leveraging Technology for Financial Statement Analysis
There are a number of software programs available that can help financial analysts to analyze financial statements. These programs can automate many of the calculations involved in financial statement analysis, which can save analysts time and help to improve the accuracy of their analysis.
Some of the most popular financial statement analysis software programs include:
- Bloomberg: Bloomberg is a financial data and analytics platform that provides users with access to a wide range of financial data and tools. Bloomberg can be used to perform a variety of financial statement analysis tasks, including ratio analysis, benchmarking, and trend analysis.
- FactSet: FactSet is a financial data and analytics platform that provides users with access to a wide range of financial data and tools. FactSet can be used to perform a variety of financial statement analysis tasks, including ratio analysis, benchmarking, and trend analysis.
- S&P Capital IQ: S&P Capital IQ is a financial data and analytics platform that provides users with access to a wide range of financial data and tools. S&P Capital IQ can be used to perform a variety of financial statement analysis tasks, including ratio analysis, benchmarking, and trend analysis.
Conclusion
Financial statement analysis is an essential tool for investors, creditors, and other stakeholders who need to assess a company's financial performance and position. By using the tools and methods described above, financial analysts can gain valuable insights into a company's financial health.