What is the range (statistical) data set?
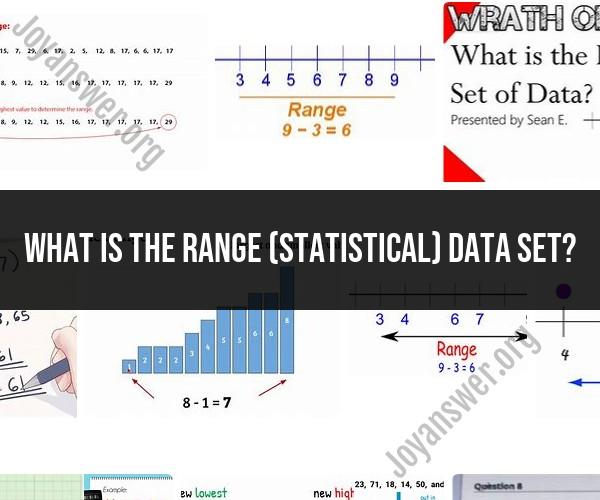
In statistics, the range of a dataset is a measure of the spread or dispersion of the values within that dataset. It provides information about the extent of variation between the minimum and maximum values in the dataset. The range is a simple and easy-to-calculate measure of variability and is often used as a quick way to assess the overall spread of data points.
To calculate the range of a dataset, follow these steps:
Find the Maximum Value: Identify the largest value in the dataset.
Find the Minimum Value: Identify the smallest value in the dataset.
Calculate the Range: Subtract the minimum value from the maximum value.
Range = Maximum Value - Minimum Value
The result is the range of the dataset.
For example, consider the following dataset representing the daily temperatures in degrees Celsius for a week:
15, 18, 20, 22, 14, 25, 17
To calculate the range:
- Maximum Value = 25 (the highest temperature in the dataset).
- Minimum Value = 14 (the lowest temperature in the dataset).
- Range = 25 - 14 = 11 degrees Celsius.
So, the range of the dataset is 11 degrees Celsius. This means that the daily temperatures vary by 11 degrees from the coldest day (14°C) to the hottest day (25°C).
While the range is a straightforward measure of spread, it has limitations. It is sensitive to outliers, meaning that extreme values in the dataset can significantly impact the range, making it less representative of the central tendency of the data. For a more robust measure of spread that is less affected by outliers, statisticians often use other measures such as the interquartile range (IQR) or standard deviation.
In statistics, the range is a measure of the spread or dispersion of a dataset. It provides insight into how spread out the values are within the dataset. The range is calculated by subtracting the minimum value from the maximum value in the dataset.
Mathematically, the range (R) of a dataset is calculated as:
Here's a breakdown of what the range signifies and how it's used:
1. Spread of Data:The range gives you a quick idea of how much the values in the dataset vary from the minimum to the maximum. A larger range indicates greater variability, while a smaller range indicates less variability.
2. Lack of Context:The range doesn't provide information about the distribution of values between the minimum and maximum. It only considers the extremes of the dataset. As a result, it can be affected by outliers (extremely high or low values) and might not accurately represent the overall distribution.
3. Quick Assessment:The range is a simple and easy-to-calculate measure that provides a basic understanding of the data's spread. It's often used as a preliminary step in exploratory data analysis.
4. Limitations:While the range is straightforward, it can be sensitive to outliers. If there are extreme values in the dataset, the range can be skewed and might not accurately reflect the typical spread of the majority of the data.
5. Complementary Measures:To get a more comprehensive view of the spread and distribution of data, it's often recommended to use other measures alongside the range. These measures include the interquartile range (IQR), variance, and standard deviation, which provide insights into the spread while considering the entire dataset.
6. Interpretation:Interpreting the range requires context. For example, if you're comparing the range of test scores between two classes, a larger range might indicate more diverse performance levels.
In summary, the range is a basic measure that provides insight into the spread of a dataset but has limitations, especially in the presence of outliers. It's often used in conjunction with other measures to get a more complete understanding of the data's distribution and variability.
