Why is probability between 0 and 1?
Probability is defined to be a value between 0 and 1 because it represents a measure of the likelihood or chance of an event occurring. The scale from 0 to 1 allows us to quantify uncertainty in a way that is intuitive and mathematically meaningful. Here's why probability is bounded between 0 and 1:
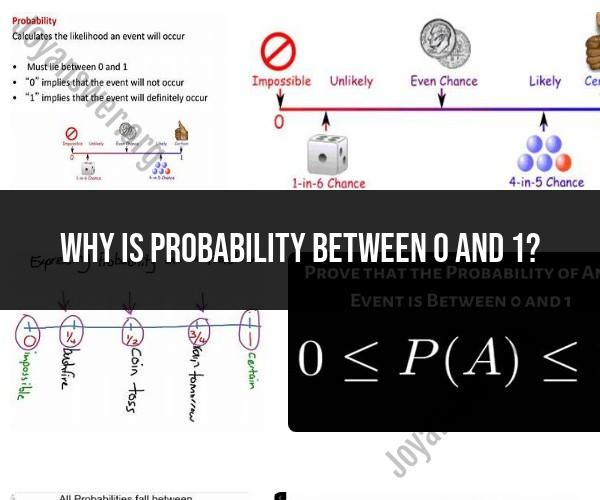
0 Represents Impossibility: A probability of 0 indicates that an event is impossible. It means that the event cannot occur under any circumstances. For example, the probability of rolling a 7 with a standard six-sided die is 0 because it's impossible.
1 Represents Certainty: A probability of 1 indicates certainty or inevitability. It means that the event is certain to occur. For example, the probability of the sun rising in the east tomorrow is 1 because it is certain to happen.
Values Between 0 and 1 Represent Likelihood: Probabilities between 0 and 1 represent degrees of likelihood. The closer the probability is to 1, the more likely the event is to occur, and the closer it is to 0, the less likely it is to occur. For example, if you flip a fair coin, the probability of getting heads is 0.5, indicating that it is equally likely to occur or not occur.
Normalization: The probability scale between 0 and 1 allows for normalization, which is a mathematical property that ensures that the sum of probabilities for all possible outcomes of an experiment or event equals 1. This normalization is essential for consistent and meaningful probability calculations.
Comparative Measure: Probabilities between 0 and 1 provide a comparative measure of the likelihood of different events. For instance, if you're comparing the likelihood of two events, you can say that an event with a probability of 0.7 is more likely than an event with a probability of 0.3.
In summary, the probability scale between 0 and 1 is a fundamental concept in probability theory that allows us to quantify uncertainty, assess the likelihood of events, and make informed decisions based on the likelihood of different outcomes. It provides a clear and consistent way to express the degree of certainty or uncertainty associated with various events or situations.
The Probability Scale: Why It's Confined Between 0 and 1
The probability scale is confined between 0 and 1 because it represents the likelihood of an event happening. An event can either happen or not happen, so the probability of it happening must be between 0 and 1.
For example, the probability of flipping a coin and getting heads is 0.5, because there are two equally likely outcomes (heads or tails). The probability of flipping a coin and getting heads twice in a row is 0.25, because there are four equally likely outcomes (heads-heads, heads-tails, tails-heads, tails-tails).
The probability of an event happening can never be greater than 1, because that would mean that the event is certain to happen. The probability of an event happening can never be less than 0, because that would mean that the event is impossible to happen.
The Mathematics of Uncertainty: Exploring Probability Boundaries
The mathematical foundation of the probability scale is based on the concept of set theory. A set is a collection of elements, and the probability of an event happening is defined as the ratio of the number of elements in the event set to the number of elements in the total set.
For example, if we have a bag containing 5 red balls and 5 blue balls, the probability of drawing a red ball is 5/10. This is because there are 5 red balls in the event set (the set of all red balls in the bag) and there are 10 total balls in the total set (the set of all balls in the bag).
The probability scale can also be used to calculate the probability of multiple events happening together. This is done by using the rules of probability, such as the addition rule and the multiplication rule.
Probability as a Measure of Certainty: The 0 to 1 Range Explained
The probability scale can be interpreted as a measure of certainty. A probability of 0 means that the event is impossible to happen. A probability of 1 means that the event is certain to happen. Probabilities between 0 and 1 represent different levels of uncertainty.
For example, a probability of 0.5 means that the event is equally likely to happen or not happen. A probability of 0.75 means that the event is more likely to happen than not happen. A probability of 0.25 means that the event is less likely to happen than not happen.
The probability scale is a powerful tool for measuring and quantifying uncertainty. It is used in a wide variety of fields, including mathematics, statistics, science, and engineering.
Here are some examples of how the probability scale can be used:
- To calculate the risk of a certain event happening, such as the risk of developing a disease or the risk of a natural disaster.
- To make decisions about investments or other financial transactions.
- To design experiments and collect data in a scientific way.
- To develop algorithms and machine learning models.
The probability scale is an essential tool for understanding and managing uncertainty in the world around us.