What is a linear inequality?
A linear inequality is a mathematical statement that describes a relationship between two algebraic expressions involving linear functions (functions where the highest power of the variable is 1) and an inequality symbol (such as <, >, ≤, or ≥). Linear inequalities are used to represent regions of a coordinate plane where certain conditions or constraints are met.
The general form of a linear inequality in one variable (let's say ) is:
Where:
- , , and are constants, with not equal to zero.
- is a linear expression in .
- The inequality symbol (<) indicates that the expression on the left-hand side is less than the expression on the right-hand side.
For example, is a linear inequality in one variable.
In two variables, such as and , a linear inequality has the form:
Where:
- , , and are constants, with at least one of and not equal to zero.
- represents a linear expression in both and .
- The inequality symbol (<) indicates that the expression on the left-hand side is less than the expression on the right-hand side.
For example, is a linear inequality in two variables.
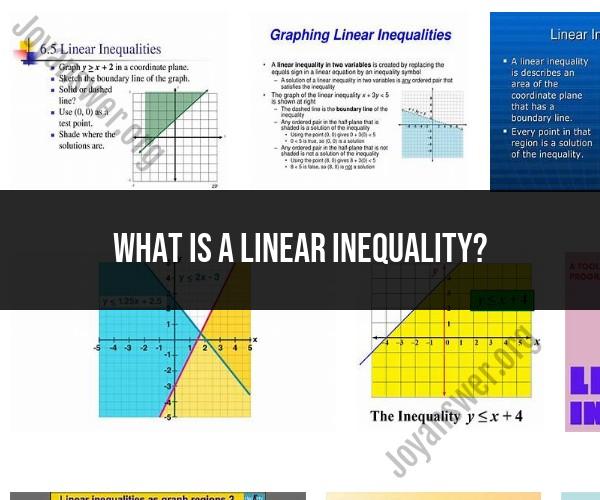
When you graph a linear inequality in two variables, you shade the region of the coordinate plane that satisfies the inequality. The boundary of this shaded region is typically a straight line, hence the term "linear" inequality.
Here's how you might graph the linear inequality :
- First, graph the corresponding equation . This line is the boundary of the shaded region.
- Then, choose a test point that is not on the boundary line. Plug the coordinates of that point into the inequality.
- If the inequality is true for that test point, shade the side of the boundary that contains the test point. If it's false, shade the opposite side.
The shaded region represents all the points (x, y) that satisfy the linear inequality .
Linear inequalities are commonly used in various fields, including economics, engineering, and optimization, to model constraints, limits, or conditions that must be satisfied in real-world problems.