What is the least square error method?
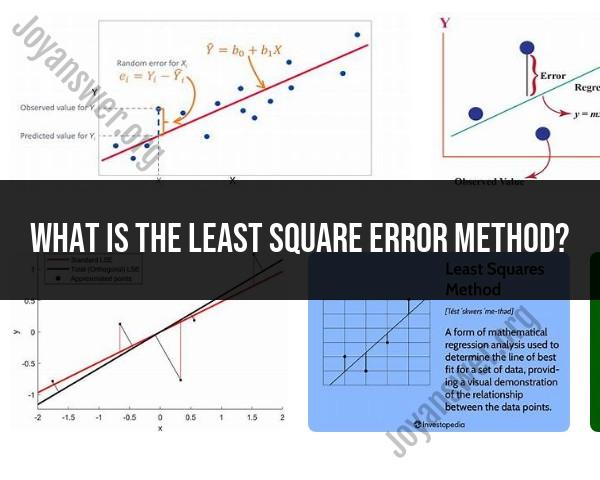
The least squares method is a statistical technique used to estimate the parameters of a mathematical model by minimizing the sum of the squares of the differences between the observed and predicted values. It's commonly applied in regression analysis to find the best-fitting line (or curve) through a set of data points.
Key Components:
Model: A mathematical representation (linear, quadratic, exponential, etc.) used to describe the relationship between variables.
Data Points: Observed data pairs (x, y) that represent the independent and dependent variables.
Objective:
The goal of the least squares method is to find the parameters of the model that minimize the sum of the squared differences between the observed values and the values predicted by the model for each data point :
Process:
Define the Model: Choose a mathematical equation that represents the relationship between the variables.
Calculate Predicted Values: Use the chosen model to calculate the predicted values based on the independent variable for each data point.
Compute Residuals: Find the differences between the observed values and the predicted values (residuals/errors).
Minimize the Sum of Squared Residuals: Adjust the parameters of the model to minimize the sum of the squared residuals by employing optimization techniques (such as calculus-based methods like gradient descent or closed-form solutions like normal equations in linear regression).
Evaluate the Fit: Assess the goodness of fit by examining the residuals, checking assumptions, and using statistical metrics like R-squared, adjusted R-squared, or others depending on the context.
Applications:
- Linear Regression: Fits a linear equation to the data.
- Nonlinear Regression: Fits nonlinear models (exponential, logarithmic, polynomial, etc.) to the data.
Importance:
- Optimal Fit: The least squares method finds parameters that minimize the discrepancy between observed and predicted values, providing the best-fit model within the chosen framework.
- Statistical Inference: Allows for inference, prediction, and understanding the relationship between variables based on data analysis.
This method is widely used in fields like economics, engineering, finance, and natural sciences to analyze data and build predictive models by finding the best-fit parameters for the given data.
Sure, here is an explanation of the least squares error method and its applications:
What is the least square error method and how is it used?
The least squares method is a statistical technique that is used to find the best fit line or curve for a set of data points. It is a common method for data fitting and regression analysis, and it is used in a wide variety of fields, including science, engineering, economics, and finance.
The least squares method works by minimizing the sum of the squared residuals, which are the differences between the observed data points and the values predicted by the fitted line or curve. By minimizing this sum, the least squares method finds the line or curve that is closest to the data points in a least squares sense.
Can you explain the application and process of the least square error method?
The least squares method is applied to a variety of problems in which there is a set of data points and the goal is to find a line or curve that best fits the data. For example, the least squares method can be used to:
- Fit a line to a set of data points. This can be useful for finding the relationship between two variables, such as the relationship between temperature and rainfall.
- Fit a curve to a set of data points. This can be useful for modeling complex relationships between variables.
- Find the parameters of a model. This can be useful for predicting the behavior of a system or process.
The process of applying the least squares method typically involves the following steps:
Collect data points: Gather a set of data points that represent the relationship you want to model.
Choose a model: Select a type of line or curve that you think will fit the data well. Common choices include linear, quadratic, and exponential models.
Minimize the sum of squared residuals: Use mathematical techniques to find the values of the model parameters that minimize the sum of squared residuals.
Evaluate the fit: Assess how well the fitted line or curve fits the data points. This can be done by calculating measures of fit, such as the coefficient of determination (R²).
How is the least square error method utilized in different contexts or fields?
The least squares method is a versatile and widely used technique that has applications in many different fields. Here are a few examples:
Science: The least squares method is used to fit models to experimental data, such as models of physical phenomena or chemical reactions.
Engineering: The least squares method is used to design and optimize systems, such as electrical circuits or mechanical structures.
Economics: The least squares method is used to analyze economic data, such as stock prices or consumer spending.
Finance: The least squares method is used to model financial markets and predict asset prices.
Computer science: The least squares method is used in machine learning algorithms to find patterns in data.