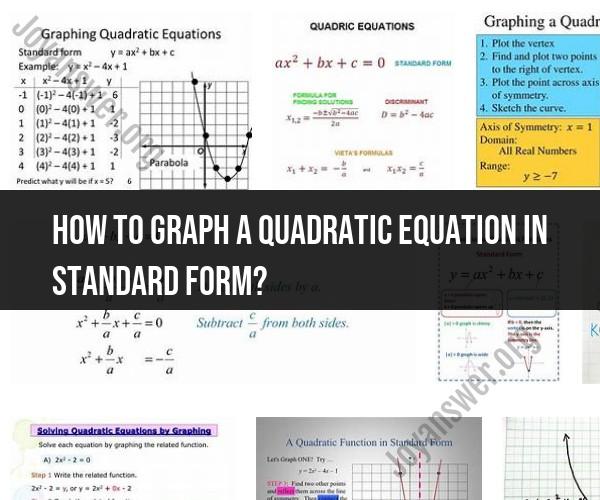
How to graph a quadratic equation in standard form?
Graphing a quadratic equation in standard form involves plotting the equation on a coordinate plane to visualize its shape. The standard form of a quadratic equation is typically written as:
Here are the easy steps to graph a quadratic equation in standard form:
Understand the Equation:
- Identify the coefficients of the quadratic equation. In the standard form, 'a,' 'b,' and 'c' represent the coefficients.
- 'a' determines the direction and steepness of the parabola (whether it opens upward or downward).
- 'b' affects the horizontal shift of the parabola.
- 'c' is the vertical shift or the y-intercept.
- Identify the coefficients of the quadratic equation. In the standard form, 'a,' 'b,' and 'c' represent the coefficients.
Determine the Vertex:
- The vertex of a quadratic equation in standard form can be found using the formula:
- The vertex () is the point where the parabola reaches its maximum or minimum value, and it's the center of symmetry.
Find Additional Points:
- Choose a few x-values on either side of the vertex, calculate the corresponding y-values using the quadratic equation, and create a table of values. You'll need at least three points to draw the graph accurately.
Plot the Vertex and Other Points:
- Plot the vertex () on the coordinate plane.
- Plot the additional points you calculated from the table of values.
Draw the Parabola:
- Connect the points smoothly to draw the parabola. The parabola's shape will depend on the sign of 'a':
- If 'a' is positive, the parabola opens upward (like a "U").
- If 'a' is negative, the parabola opens downward (like an upside-down "U").
- Connect the points smoothly to draw the parabola. The parabola's shape will depend on the sign of 'a':
Label the Axes and the Parabola:
- Label the x-axis and the y-axis.
- Label the parabola with its equation, if needed.
Add Details (Optional):
- If necessary, add features like the axis of symmetry (vertical line through the vertex) and any x- or y-intercepts.
Check for Special Cases:
- Occasionally, a quadratic equation may not have a real root (i.e., the parabola does not intersect the x-axis). In such cases, you'll have to adjust the range of x-values you consider or note that the graph does not cross the x-axis.
By following these steps, you can easily graph a quadratic equation in standard form and visualize its shape on the coordinate plane. Understanding the coefficients and properties of the quadratic equation helps you determine the key features of the graph, including the vertex, direction of opening, and shape of the parabola.
Graphing Quadratic Equations in Standard Form: Easy Steps
Step 1: Identify the key features of the parabola.
The key features of a parabola include its vertex, axis of symmetry, and y-intercept. To find these features, you can use the following formulas:
- Vertex: (h, k) = (-b/2a, -d/4a)
- Axis of symmetry: x = h
- Y-intercept: (0, d)
For example, consider the following quadratic equation in standard form:
y = x^2 + 4x + 3
Using the formulas above, we can find the following key features:
- Vertex: (-2, -1)
- Axis of symmetry: x = -2
- Y-intercept: (0, 3)
Step 2: Plot the key features.
Once you have identified the key features of the parabola, you can plot them on a graph. Be sure to label the vertex, axis of symmetry, and y-intercept.
Step 3: Connect the dots.
To graph the parabola, simply connect the dots that you plotted in step 2. Remember that the parabola is symmetrical around its axis of symmetry.
Step 4: Check your work.
Once you have finished graphing the parabola, you can check your work by plugging in a few different x-values and solving for y. The resulting points should lie on the parabola.
Visualizing Standard Form Quadratic Equations: Graphing Tips
Here are a few tips for visualizing and graphing standard form quadratic equations:
- Pay attention to the a-coefficient. The a-coefficient determines whether the parabola opens up or down. If a is positive, the parabola opens up. If a is negative, the parabola opens down.
- Look for the vertex. The vertex is the highest or lowest point on the parabola. It is located at (-b/2a, -d/4a).
- Consider the axis of symmetry. The axis of symmetry is a vertical line that passes through the vertex. The parabola is symmetrical around its axis of symmetry.
- Use the y-intercept. The y-intercept is the point where the parabola crosses the y-axis. It is located at (0, d).
Plotting Quadratic Functions: How to Graph in Standard Form
To plot a quadratic function in standard form, you can use the following steps:
- Choose a scale. Decide how many units each tick mark on your graph will represent.
- Plot the vertex. The vertex is the highest or lowest point on the parabola. It is located at (-b/2a, -d/4a).
- Plot the axis of symmetry. The axis of symmetry is a vertical line that passes through the vertex. The parabola is symmetrical around its axis of symmetry.
- Plot the y-intercept. The y-intercept is the point where the parabola crosses the y-axis. It is located at (0, d).
- Plot additional points. To get a more accurate picture of the parabola, plot additional points. You can do this by plugging in different x-values into the quadratic equation and solving for y.
- Connect the dots. Connect the points that you plotted in step 5 with a smooth curve.
By following these steps, you can easily graph any quadratic function in standard form.