What are the ggplot2 packages?
Exploring the ggplot2 package for advanced data visualization can greatly enhance your data analysis and presentation capabilities. Here's a guide to help you get started:
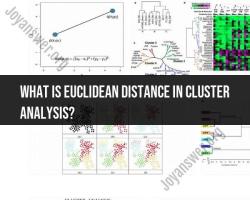
1. Introduction to ggplot2:
- What is ggplot2?
- ggplot2 is an R package for creating highly customizable and sophisticated data visualizations. It's based on the grammar of graphics concept, which provides a structured and intuitive way to create visualizations.
2. Installation and Setup:
- Install ggplot2:
- If you haven't already, install the ggplot2 package in R using the
install.packages("ggplot2")command. Load it into your workspace withlibrary(ggplot2).
- If you haven't already, install the ggplot2 package in R using the
3. Basic Data Visualization:
- Create a Basic Plot:
- Start with a basic scatter plot, bar chart, or line chart to visualize your data. Use the
ggplot()function to initialize the plot and add layers of information to it.
- Start with a basic scatter plot, bar chart, or line chart to visualize your data. Use the
4. Data Mapping:
- Mapping Aesthetics:
- ggplot2 allows you to map variables to aesthetics like color, size, shape, and position. For example, you can map a categorical variable to the color of points in a scatter plot.
5. Advanced Customization:
Customizing Themes:
- Customize the appearance of your plots using themes. You can change fonts, colors, grid lines, and more to match your preferred style.
Faceting:
- Create multiple plots based on one or more categorical variables using faceting. This is useful for comparing data across different categories.
Geometric Objects:
- ggplot2 supports various geometric objects (geoms) such as
geom_point(),geom_bar(),geom_line(), and more. You can use these geoms to modify the plot type and appearance.
- ggplot2 supports various geometric objects (geoms) such as
Statistics:
- Apply statistical transformations to your data within ggplot2. For example, you can add a trendline to a scatter plot or calculate the mean and confidence intervals for a bar chart.
6. Data Wrangling with dplyr:
- Combine ggplot2 with dplyr:
- Use the dplyr package to manipulate and preprocess your data before creating visualizations. It works seamlessly with ggplot2 for data wrangling.
7. Save and Export:
- Saving Plots:
- Save your visualizations as image files (e.g., PNG, JPEG) or as vector graphics (e.g., PDF, SVG) using functions like
ggsave().
- Save your visualizations as image files (e.g., PNG, JPEG) or as vector graphics (e.g., PDF, SVG) using functions like
8. Resources and Documentation:
Official ggplot2 Documentation:
- Refer to the official ggplot2 documentation and cheat sheets available on the ggplot2 website for in-depth guidance.
Online Tutorials and Examples:
- Explore online tutorials, blogs, and examples shared by the R community to learn more advanced techniques and tricks.
9. Practice and Experiment:
- Experiment with Data:
- Practice creating various types of plots, and experiment with different aesthetics and customization options to refine your visualization skills.
10. Share Your Insights:
- Use ggplot2 for Reports and Presentations:
- Incorporate ggplot2 visualizations into reports, presentations, and data storytelling to communicate your insights effectively.
By exploring ggplot2 and mastering its capabilities, you can create advanced and visually compelling data visualizations that enhance your data analysis and make it easier to convey your findings to others. It's a valuable tool for anyone working with data in R.