How to present a research paper using PowerPoint [sample?
Certainly! When presenting a research paper using PowerPoint, the goal is to succinctly convey key points, data, and findings to engage your audience. Here's a sample approach:
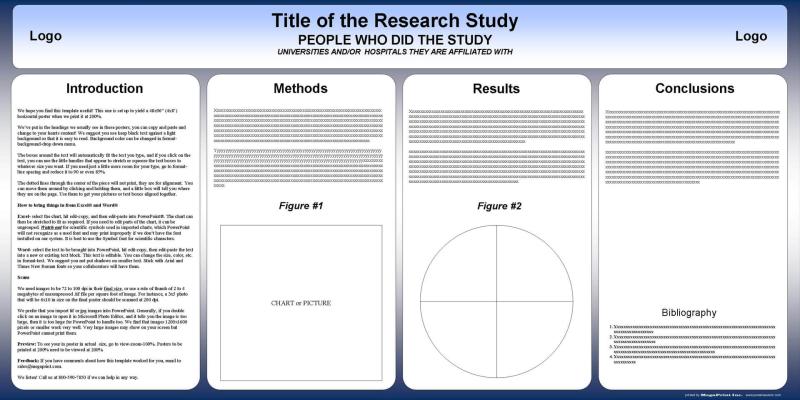
Slide 1: Title Slide
- Title of the research paper
- Your name and academic affiliation
- Date of presentation
Slide 2: Introduction
- Briefly introduce the topic and its significance
- State the research question or objective
- Outline the structure of your presentation
Slide 3: Research Objectives or Hypothesis
- Present the main objectives or hypotheses of your research
Slide 4: Literature Review
- Summarize key literature and studies relevant to your research
- Highlight gaps in existing research that your study addresses
Slide 5: Methodology
- Describe the research methodology used (e.g., survey, experiments, case studies)
- Include information about sample size, data collection methods, and analysis techniques
Slide 6: Data Collection
- Present an overview of the data collected
- Include any important statistics or demographics
Slide 7: Results
- Showcase the main findings of your research
- Use charts, graphs, or visuals to illustrate key data points
Slide 8: Analysis and Interpretation
- Analyze the results and discuss their implications
- Interpret the data to support your research objectives or hypothesis
Slide 9: Discussion
- Provide a critical discussion of your findings
- Address limitations and challenges encountered during the research
Slide 10: Conclusion
- Summarize the main points of your research
- Reiterate the significance of your findings and their implications
Slide 11: Recommendations (if applicable)
- Offer suggestions for future research or practical recommendations stemming from your findings
Slide 12: Acknowledgments
- Acknowledge any individuals, institutions, or funding sources that contributed to your research
Slide 13: Q&A
- Invite questions from the audience
- Use this slide as a transition to the question-and-answer session
Tips:
- Keep text concise and use bullet points for clarity
- Use visuals (charts, graphs, images) to enhance understanding
- Maintain a consistent design theme and font throughout the presentation
- Practice your presentation multiple times to ensure smooth delivery within the allotted time
Remember, the PowerPoint slides should complement your verbal presentation rather than duplicate it. Use them to highlight key points and guide the audience through your research paper effectively.
Effectively presenting your research paper using PowerPoint involves careful design, content organization, and practice to ensure a clear and engaging delivery. Here are five key steps to enhance your presentation:
- Choosing an Appropriate PowerPoint Template:
Select a PowerPoint template that aligns with the tone and content of your research paper. The template's style and color scheme should complement the subject matter and maintain a professional appearance. Ensure the template provides enough flexibility to accommodate your research findings and visuals.
- Designing Visually Appealing and Informative Slides:
Design slides that are visually appealing and informative, effectively summarizing key points and findings. Use concise bullet points, highlight essential information, and incorporate relevant visuals to enhance understanding. Maintain a consistent font style and size throughout the presentation. Avoid cluttering slides with excessive text or visuals that could distract the audience.
- Utilizing Transitions and Animations Sparingly:
Use transitions and animations sparingly to maintain focus on the content and avoid distractions. Overuse of animations can be overwhelming and detract from the core message of your presentation. Subtle transitions can help guide the audience through the slides, while well-placed animations can emphasize key points.
- Incorporating Relevant Images, Graphs, and Charts:
Incorporate relevant images, graphs, and charts to enhance understanding and data visualization. Images should be high-quality and relevant to the topic. Graphs and charts should be clear, accurate, and easy to interpret. Use visuals to highlight trends, patterns, and relationships within the data. Label axes clearly and provide concise explanations of each visual.
- Practicing Your Presentation with PowerPoint Slides:
Practice your presentation with the PowerPoint slides to ensure a smooth and confident delivery. Familiarize yourself with the transitions, animations, and slide layout. Practice speaking at a moderate pace, enunciating clearly, and maintaining eye contact with the audience. Time your presentation to ensure it fits within the allotted time frame.
