What is the normal distribution table?
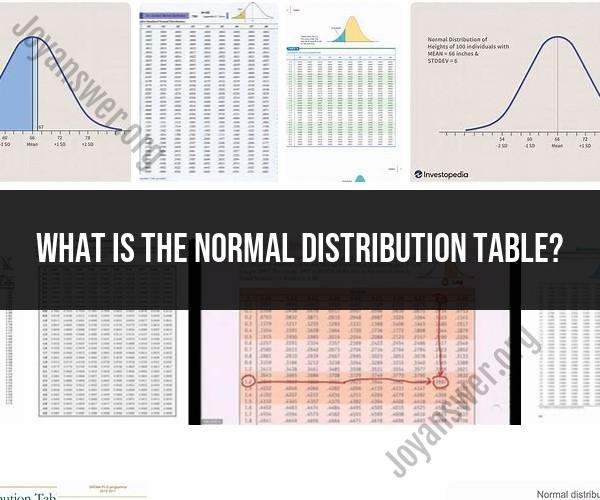
The normal distribution table, also known as the standard normal distribution table or the Z-table, is a mathematical table that provides critical values and probabilities associated with the standard normal distribution, which is a specific type of normal distribution with a mean (average) of 0 and a standard deviation of 1. This distribution is often denoted by the symbol "Z."
Here's how the normal distribution table works:
Z-Score: To use the table, you first need to calculate the Z-score of a given value from a normally distributed dataset. The Z-score is a measure of how many standard deviations a particular value is away from the mean. The formula for calculating the Z-score of a data point "X" in a normally distributed population is:
Where:
- is the Z-score.
- is the data point you want to find the Z-score for.
- is the population mean (average).
- is the population standard deviation.
Using the Table: Once you have the Z-score, you can use the normal distribution table to find the corresponding probability or percentile associated with that Z-score. The table typically provides Z-scores in one column and corresponding probabilities (areas under the normal curve) in another column.
To find the probability of a Z-score, locate the Z-score in the table and read off the corresponding probability value. This tells you the likelihood of obtaining a value less than or equal to the given Z-score in a standard normal distribution.
To find the percentile associated with a Z-score, locate the Z-score in the table and read off the corresponding percentile value. This tells you the percentage of data points in a standard normal distribution that fall below the given Z-score.
The normal distribution table is a valuable tool in statistics and probability theory. It allows researchers and statisticians to determine the likelihood of observing specific values or events in a normally distributed population. It is commonly used in hypothesis testing, confidence intervals, and other statistical calculations.
With advancements in technology, many statistical software programs and calculators can perform these calculations automatically, reducing the reliance on printed Z-tables. However, understanding the concept of the normal distribution table and how to interpret Z-scores and probabilities is still important for statistical analysis and research.