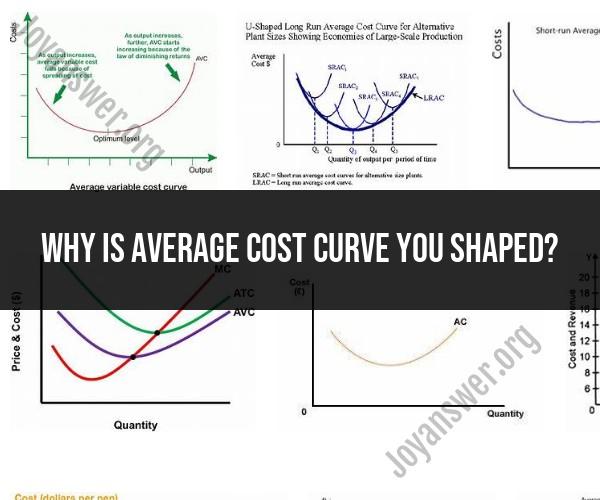
Why is average cost curve you shaped?
The U-shaped average cost curve is a fundamental concept in microeconomics and represents the relationship between a firm's average total cost (ATC) and the level of production (quantity of output). The U-shaped curve is derived from several economic factors and explanations:
Economies of Scale: Initially, as a firm increases its level of production (output), it often experiences economies of scale. Economies of scale occur when the average cost of producing each additional unit of output decreases as production expands. This is typically because fixed costs, like machinery and infrastructure, can be spread over a larger number of units, reducing the per-unit cost.
Increased Specialization: As production increases, workers can specialize in specific tasks, leading to higher efficiency and lower average costs. Specialization allows workers to become more skilled and efficient at their specific roles, which can lead to cost savings.
Bulk Purchasing: Larger production quantities often allow firms to negotiate better deals with suppliers. Bulk purchasing of raw materials, components, or inputs can result in lower per-unit costs, contributing to lower average costs.
Technological Advancements: As a firm grows and invests in technology and automation, it can become more efficient in its production processes. Technological advancements can reduce labor costs and improve overall productivity, resulting in lower average costs.
Optimal Use of Resources: Larger firms have more resources to allocate efficiently. This includes better resource allocation, production planning, and management practices, all of which can lead to cost savings.
Diseconomies of Scale: However, as production continues to increase beyond a certain point, firms may encounter diseconomies of scale. Diseconomies of scale occur when the benefits of scale are outweighed by the costs associated with managing a large organization. These costs can include increased bureaucracy, communication challenges, and difficulties in maintaining employee morale and motivation.
Inefficiencies: In some cases, as firms grow too large, they may become less efficient in certain areas. For example, decision-making processes may become slow and bureaucratic, leading to inefficiencies that drive up costs.
Specialization Limits: While specialization can lead to cost savings, there is a point at which further specialization may not be possible or beneficial. This can contribute to the rising part of the U-shaped curve.
Resource Constraints: Firms may face resource constraints, such as limited access to raw materials or a saturated market, which can hinder their ability to achieve lower average costs at higher production levels.
In summary, the U-shaped average cost curve reflects the interplay of economies of scale and diseconomies of scale as a firm changes its level of production. Initially, as production increases, economies of scale dominate, leading to lower average costs. However, beyond a certain point, diseconomies of scale can offset these gains, causing average costs to rise. The exact shape and location of the U-shaped curve can vary among firms and industries based on their unique circumstances and cost structures.